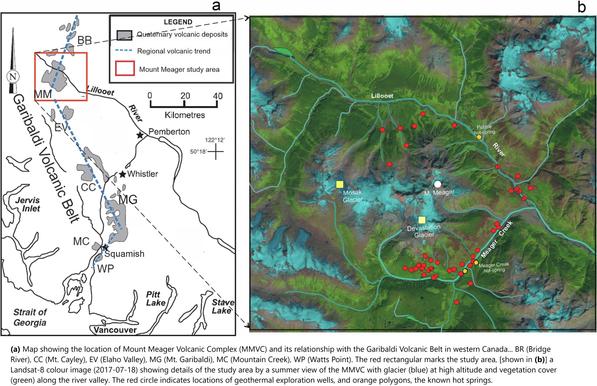
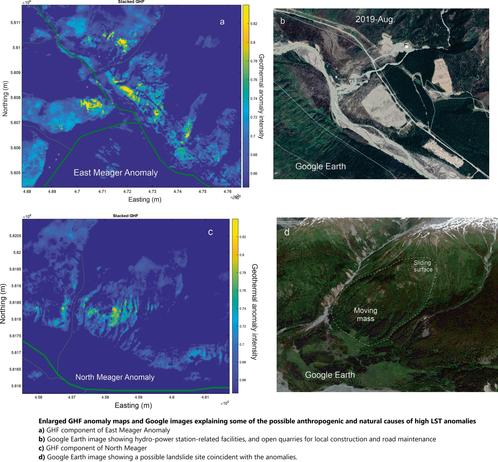
Identification Of Geothermal Anomalies From Landsat Derived Land Surface Temperature, Mount Meager Volcanic Complex, British Columbia, Canada
--
https://doi.org/10.1016/j.rse.2025.114649 <-- shared paper
--
“Highlights:
• A novel method for detecting geothermal components from solar energy dominated LST.
• Using LST time series to eliminate temporal variant solar energy input.
• Uncertainty in anomaly identification quantified by probability measure.
• Capable of revealing LST anomalies caused by geothermal, anthropogenic and surface processes..."
#GIS #spatial #mapping #britishcolumbia #BC #solar #geothermal #remotesensing #earthobservation #LST #spatialanalysis #spatiotemporal #naturalresources #volcanic #geology #geostatistics #landsurfacetemperature #satellite #geothermalheatflux #GHF #energybalance #calculation #model #MountMeager #Landsat #landsat8 #hotspring #landslide #massmovement #engineeringgeology #spring #seep #anthropogenic #HEP #hydropower #monitoring #risk #hazard
A Methodology for the Multitemporal Analysis of Land Cover Changes and Urban Expansion Using Synthetic Aperture Radar (SAR) Imagery: A Case Study of the Aburrá Valley in Colombia

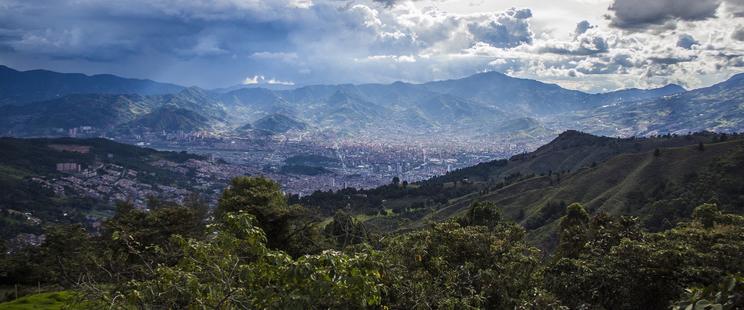
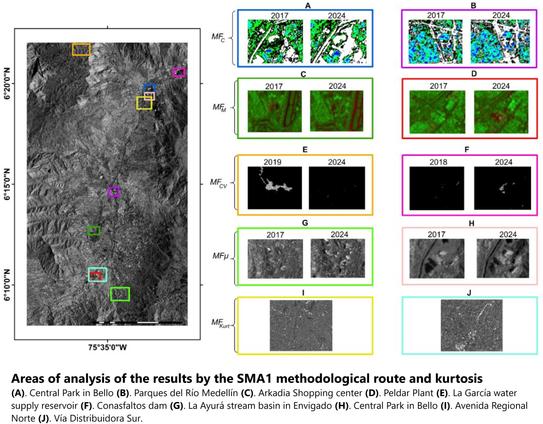
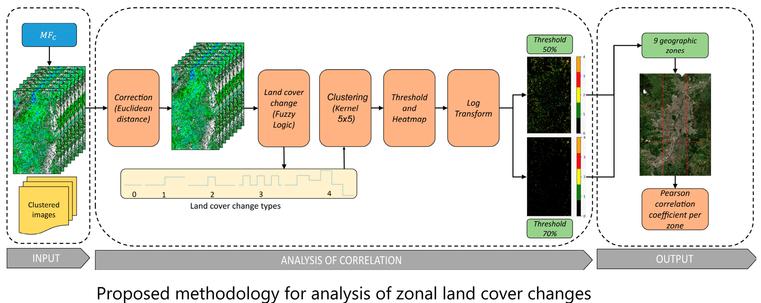
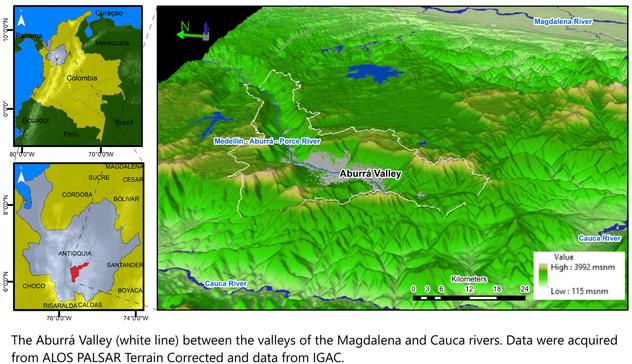
The Aburrá Valley, located in the northwestern region of Colombia, has undergone significant land cover changes and urban expansion in recent decades, driven by rapid population growth and infrastructure development. This region, known for its steep topography and dense urbanization, faces considerable environmental challenges. Monitoring these transformations is essential for informed territorial planning and sustainable development. This study leverages Synthetic Aperture Radar (SAR) imagery from the Sentinel-1 mission, covering 2017–2024, to propose a methodology for the multitemporal analysis of land cover dynamics and urban expansion in the valley. The novel proposed methodology comprises several steps: first, monthly SAR images were acquired for every year under study from 2017 to 2024, ensuring the capture of surface changes. These images were properly calibrated, rescaled, and co-registered. Then, various multitemporal fusions using statistics operations were proposed to detect and find different phenomena related to land cover and urban expansion. The methodology also involved statistical fusion techniques—median, mean, and standard deviation—to capture urbanization dynamics. The kurtosis calculations highlighted areas where infrequent but significant changes occurred, such as large-scale construction projects or sudden shifts in land use, providing a statistical measure of surface variability throughout the study period. An advanced clustering technique segmented images into distinctive classes, utilizing fuzzy logic and a kernel-based method, enhancing the analysis of changes. Additionally, Pearson correlation coefficients were calculated to explore the relationships between identified land cover change classes and their spatial distribution across nine distinct geographic zones in the Aburrá Valley. The results highlight a marked increase in urbanization, particularly along the valley’s periphery, where previously vegetated areas have been replaced by built environments. Additionally, the visual inspection analysis revealed areas of high variability near river courses and industrial zones, indicating ongoing infrastructure and construction projects. These findings emphasize the rapid and often unplanned nature of urban growth in the region, posing challenges to both natural resource management and environmental conservation efforts. The study underscores the need for the continuous monitoring of land cover changes using advanced remote sensing techniques like SAR, which can overcome the limitations posed by cloud cover and rugged terrain. The conclusions drawn suggest that SAR-based multitemporal analysis is a robust tool for detecting and understanding urbanization’s spatial and temporal dynamics in regions like the Aburrá Valley, providing vital data for policymakers and planners to promote sustainable urban development and mitigate environmental degradation.
MDPI
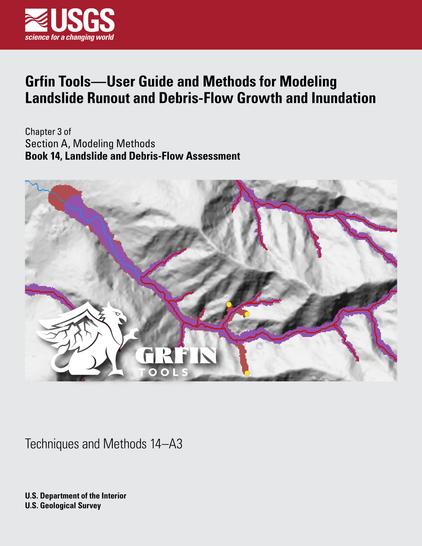
Grfin Tools—User guide and methods for modeling landslide runout and debris-flow growth and inundation

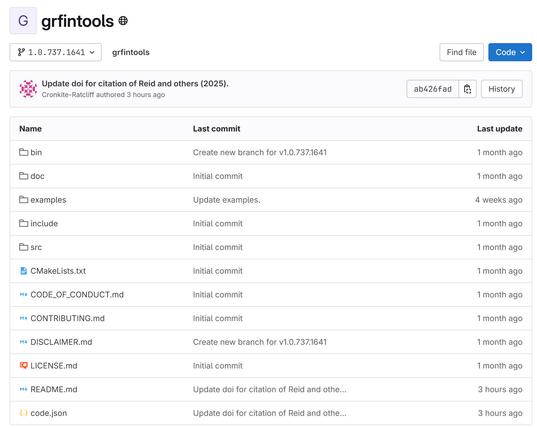
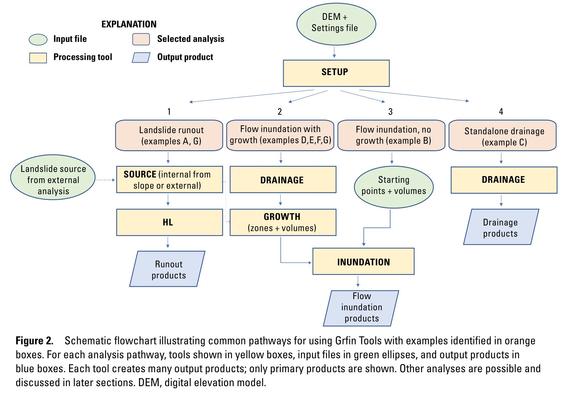
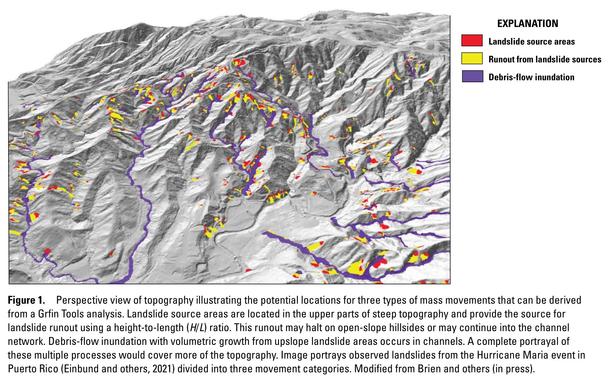
The software package, Grfin Tools, can estimate potential runout from landslides or inundation from geophysical mass flows such as debris flows, lahars from volcanoes, and rock avalanches within a digital elevation model (DEM). Grfin is an acronym of growth + flow + inundation. The tools within this package apply simple, well-tested, empirical models of runout that are computationally efficient and require minimal parameters. These tools can be used individually (for example, to estimate debris-flow inundation) or in combination to represent a more complete series of linked processes, from landslide source areas, to unchannelized transport, to channelized flows. Grfin Tools can rapidly assess potential runout and inundation over large areas and the results are readily visualized in a geographic information system.Tools for assessing areas affected by runout and flow inundation include a height-to-length (H/L) ratio, angle-of-reach approach for estimating open-slope, unchannelized landslide runout, and volume-area scaling relations for assessing flow inundation...

QGIS Processing Toolbox tool for Variogram Modeling and Ordinary Kriging using GSTools
This tool automates variogram modeling and kriging within QGIS, providing a user-friendly interface for spatial interpolation.
#qgis #geostatistics #kriging #prediction #variogram #python #gstools #gstat
https://github.com/geosaber/geostat
GitHub - geosaber/geostat: QGIS Processing Toolbox tool for Variogram Modeling and Ordinary Kriging using GSTools

QGIS Processing Toolbox tool for Variogram Modeling and Ordinary Kriging using GSTools - geosaber/geostat

GitHub
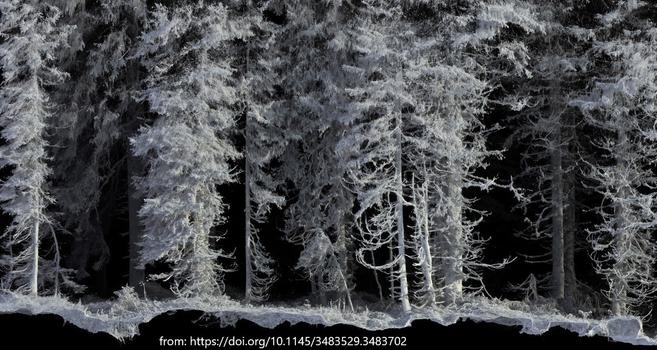
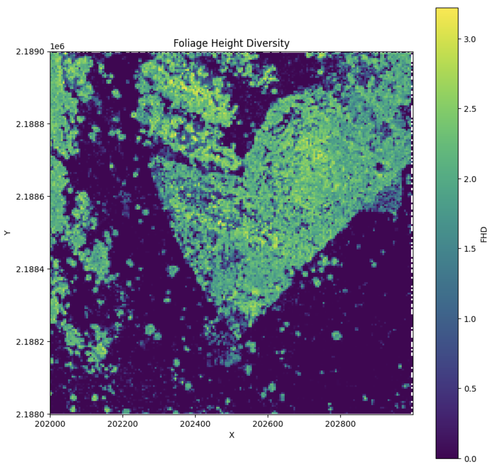
PyForestScan: A Python library for calculating forest structural metrics from lidar point cloud data

Percival et al., (2025). PyForestScan: A Python library for calculating forest structural metrics from lidar point cloud data. Journal of Open Source Software, 10(106), 7314, https://doi.org/10.21105/joss.07314

Journal of Open Source Software
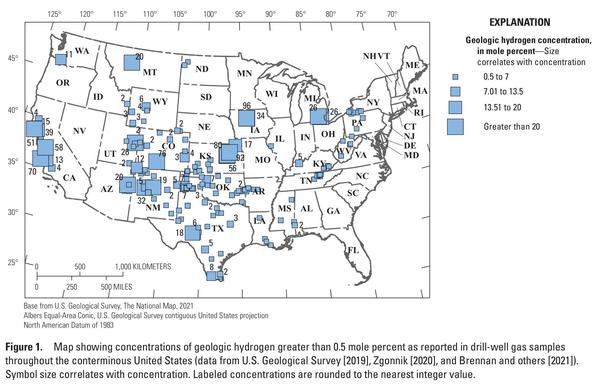
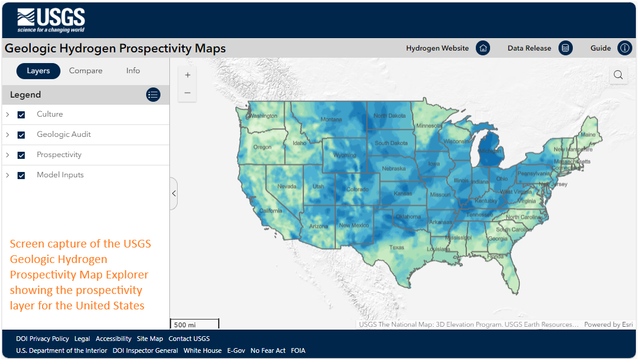
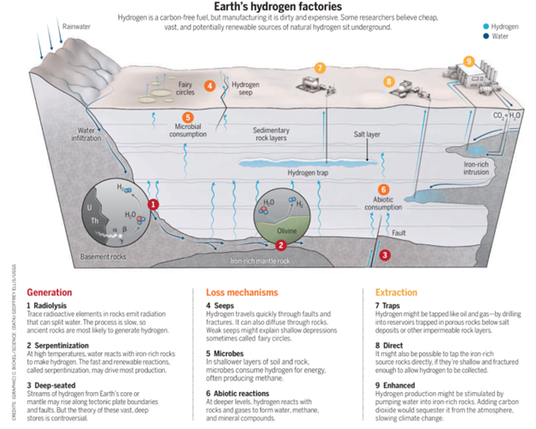
Geologic Hydrogen Prospectivity Map Explorer

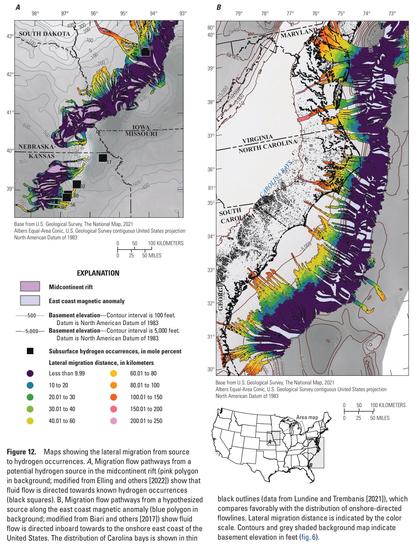
The Geologic Hydrogen Prospectivity Map Explorer hosts various geologic and geophysical data layers in support of the U.S. Geological Survey’s initiative to map the potential of geologic hydrogen within the conterminous U.S. This first-ever Hydrogen Map Explorer contains 19 input maps and 7 integrated maps that highlight prospective areas for naturally occurring hydrogen across the country.

USGS
Dream Jobs Around The World - The Careers People Are Searching For The Most
--
https://www.remitly.com/gb/en/landing/dream-jobs-around-the-world <-- shared article
--
[I do like the New Zealanders want to be DJs :) ‘Influencer’ is – thankfully – only hinted at, NOT being a real job, just glorified begging…]“
#GIS #spatial #mapping #FridayFeeling #FridayFun #jobs #careers #global #immigration #emigration #roles #professions #newjob #GoogleSearch #geostatistics #global
Dream Jobs Around the World Study | Remitly

Our new study reveals which dream jobs people are most interested in around the world. Explore the findings here.

Remitly

there are a couple of hours left to submit a #geostatistics
abstract to #EGU25
:-)

looking forward to your contribution!