Beyond the Dataset

On the recent season of the show Clarkson’s farm, J.C. goes through great lengths to buy the right pub. As with any sensible buyer, the team does a thorough tear down followed by a big build up before the place is open for business. They survey how the place is built, located, and accessed. In their refresh they ensure that each part of the pub is built with purpose. Even the tractor on the ceiling. The art is  in answering the question: How was this place put together? 

A data-scientist should be equally fussy. Until we trace how every number was collected, corrected and cleaned, —who measured it, what tool warped it, what assumptions skewed it—we can’t trust the next step in our business to flourish.

Old sound (1925) painting in high resolution by Paul Klee. Original from the Kunstmuseum Basel Museum. Digitally enhanced by rawpixel.

Two load-bearing pillars

While there are many flavors of data science I’m concerned about the analysis that is done in scientific spheres and startups. In this world, the structure held up by two pillars:

  • How we measure — the trip from reality to raw numbers. Feature extraction.
  • How we compare — the rules that let those numbers answer a question. Statistics and causality.
  • Both of these related to having a deep understanding of the data generation process. Each from a different angle. A crack in either pillar and whatever sits on top crumbles. Plots, significance, AI predictions, mean nothing.

    How we measure

    A misaligned microscope is the digital equivalent of crooked lumber. No amount of massage can birth a photon that never hit the sensor. In fluorescence imaging, the point-spread function tells you how a pin-point of light smears across neighboring pixels; noise reminds you that light itself arrives from and is recorded by at least some randomness. Misjudge either and the cell you call “twice as bright” may be a mirage.

    In this data generation process the instrument nuances control what you see. Understanding this enables us to make judgements about what kind of post processing is right and which one may destroy or invent data. For simpler analysis the post processing can stop at cleaner raw data. For developing AI models, this process extends to labeling and analyzing data distributions. Andrew Ng’s approach, in data-centric AI, insists that tightening labels, fixing sensor drift, and writing clear provenance notes often beat fancier models.

    How we compare

    Now suppose Clarkson were to test a new fertilizer, fresh goat pellets, only on sunny plots. Any bumper harvest that follows says more about sunshine than about the pellets. Sound comparisons begin long before data arrive. A deep understanding of the science behind the experiment is critical before conducting any statistics. The wrong randomization, controls, and lurking confounder eat away at the foundation of statistics.

    This information is not in the data. Only understanding how the experiment was designed and which events preclude others enable us to build a model of the world of the experiment. Taking this lightly has large risks for startups with limited budgets and smaller experiments. A false positive result leads to wasted resources while a false negative presents opportunity costs.   

    The stakes climb quickly. Early in the COVID-19 pandemic, some regions bragged of lower death rates. Age, testing access, and hospital load varied wildly, yet headlines crowned local policies as miracle cures. When later studies re-leveled the footing, the miracles vanished. 

    Why the pillars get skipped

    Speed, habit, and misplaced trust. Leo Breiman warned in 2001 that many analysts chase algorithmic accuracy and skip the question of how the data were generated. What he called the “two cultures.” Today’s tooling tempts us even more: auto-charts, one-click models, pretrained everything. They save time—until they cost us the answer.

    The other issue is lack of a culture that communicates and shares a common language. Only in academic training is it possible to train a single person to understand the science, the instrumentation, and the statistics sufficiently that their research may be taken seriously. Even then we prefer peer review. There is no such scope in startups. Tasks and expertise must be split. It falls to the data scientist to ensure clarity and collecting information horizontally. It is the job of the leadership to enable this or accept dumb risks.

    Opening day

    Clarkson’s pub opening was a monumental task with a thousand details tracked and tackled by an army of experts. Follow the journey from phenomenon to file, guard the twin pillars of measure and compare, and reinforce them up with careful curation and open culture. Do that, and your analysis leaves room for the most important thing: inquiry.

    #AI #causalInference #cleanData #dataCentricAI #dataProvenance #dataQuality #dataScience #evidenceBasedDecisionMaking #experimentDesign #featureExtraction #foundationEngineering #instrumentation #measurementError #science #startupAnalytics #statisticalAnalysis #statistics

    Introducing IMGS.AI, a multimodal search engine revolutionizing Digital Art History! Built with cutting-edge ML models like CLIP, it addresses image retrieval challenges and proposes solutions for standardizing feature extraction.
    By @zentralwerkstatt & @peterbell
    #DigitalArtHistory #MachineLearning #ComputerVision #CLIPModel #HCI #BigImageData #FeatureExtraction
    https://dahj.org/article/imgsai
    IMGS.AI. A Multimodal Search Engine for Digital Art History — DAHJ

    We present a web application that facilitates multimodal search within institutional image collections using current-generation machine learning models like CLIP

    DAHJ
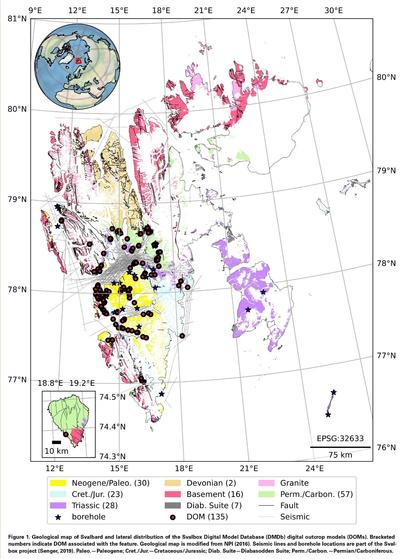
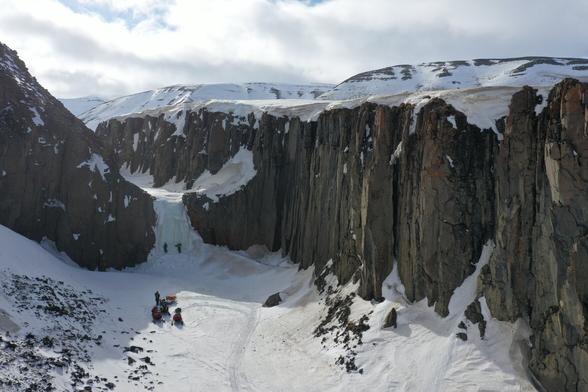
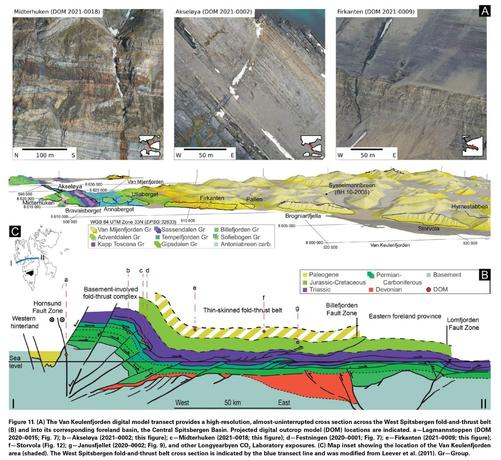
    Making Arctic field geology accessible by digitizing outcrops

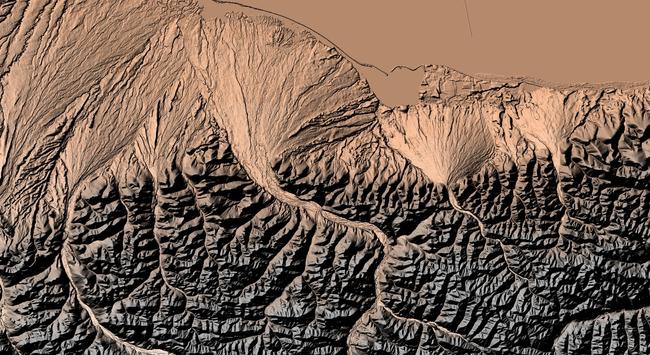
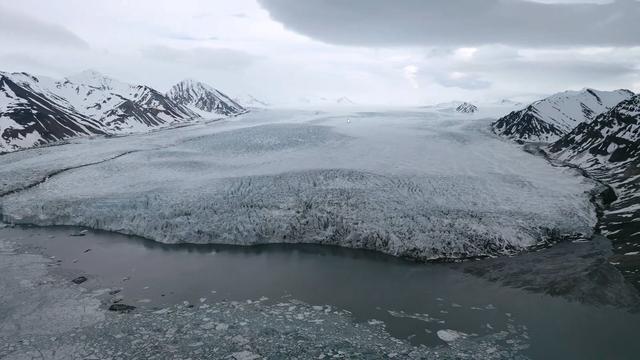
    The Svalbox Digital Model Database (DMDb) just made its formal debut into the scientific community in a new article published in the journal Geosphere.

    Phys.org
    Extensibility of U-Net Neural Network Model for Hydrographic Feature Extraction and Implications for Hydrologic Modeling

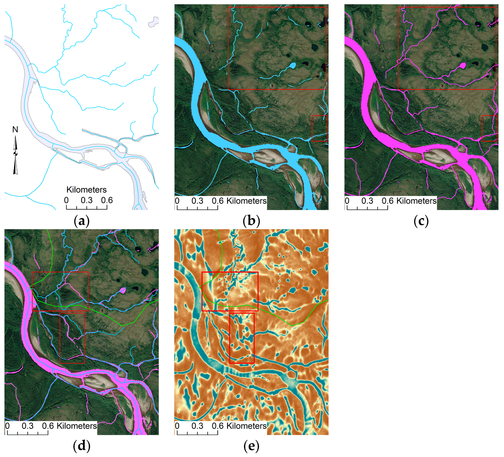
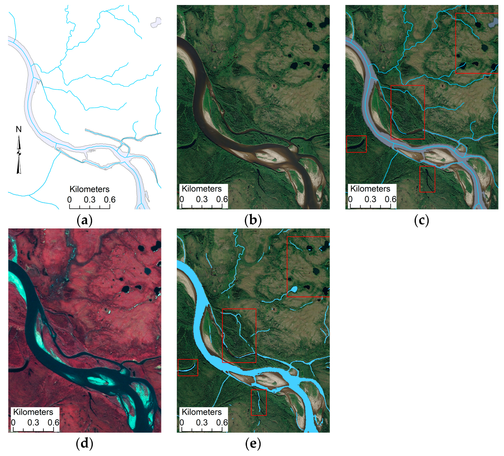
    Accurate maps of regional surface water features are integral for advancing ecologic, atmospheric and land development studies. The only comprehensive surface water feature map of Alaska is the National Hydrography Dataset (NHD). NHD features are often digitized representations of historic topographic map blue lines and may be outdated. Here we test deep learning methods to automatically extract surface water features from airborne interferometric synthetic aperture radar (IfSAR) data to update and validate Alaska hydrographic databases. U-net artificial neural networks (ANN) and high-performance computing (HPC) are used for supervised hydrographic feature extraction within a study area comprised of 50 contiguous watersheds in Alaska. Surface water features derived from elevation through automated flow-routing and manual editing are used as training data. Model extensibility is tested with a series of 16 U-net models trained with increasing percentages of the study area, from about 3 to 35 percent. Hydrography is predicted by each of the models for all watersheds not used in training. Input raster layers are derived from digital terrain models, digital surface models, and intensity images from the IfSAR data. Results indicate about 15 percent of the study area is required to optimally train the ANN to extract hydrography when F1-scores for tested watersheds average between 66 and 68. Little benefit is gained by training beyond 15 percent of the study area. Fully connected hydrographic networks are generated for the U-net predictions using a novel approach that constrains a D-8 flow-routing approach to follow U-net predictions. This work demonstrates the ability of deep learning to derive surface water feature maps from complex terrain over a broad area.

    MDPI

    `It is considered a non-linear approach as the mapping cannot be represented as a linear combination of the original variables as possible in techniques such as principal component analysis, which also makes it more difficult to use for classification applications`

    https://en.wikipedia.org/wiki/Sammon_mapping

    #machineLearning #clustering #classification #featureExtraction #featureEngineering #featureSelection #featureRanking #dimensionalityReduction #nonlinear

    Sammon mapping - Wikipedia

    A Topological Deep Learning Framework for Neural Spike Decoding

    The brain's spatial orientation system uses different neuron ensembles to aid in environment-based navigation. Two of the ways brains encode spatial information is through head direction cells and grid cells. Brains use head direction cells to determine orientation whereas grid cells consist of layers of decked neurons that overlay to provide environment-based navigation. These neurons fire in ensembles where several neurons fire at once to activate a single head direction or grid. We want to capture this firing structure and use it to decode head direction grid cell data. Understanding, representing, and decoding these neural structures requires models that encompass higher order connectivity, more than the 1-dimensional connectivity that traditional graph-based models provide. To that end, in this work, we develop a topological deep learning framework for neural spike train decoding. Our framework combines unsupervised simplicial complex discovery with the power of deep learning via a new architecture we develop herein called a simplicial convolutional recurrent neural network. Simplicial complexes, topological spaces that use not only vertices and edges but also higher-dimensional objects, naturally generalize graphs and capture more than just pairwise relationships. Additionally, this approach does not require prior knowledge of the neural activity beyond spike counts, which removes the need for similarity measurements. The effectiveness and versatility of the simplicial convolutional neural network is demonstrated on head direction and trajectory prediction via head direction and grid cell datasets.

    arXiv.org