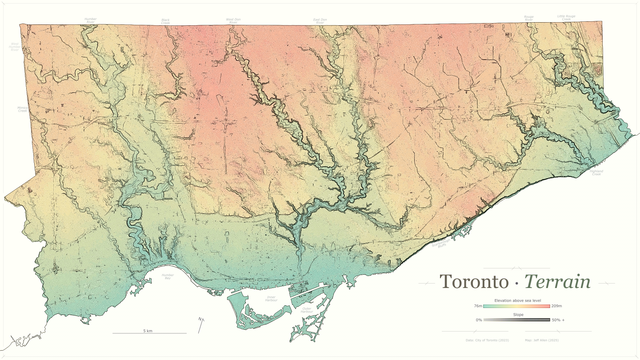
recent map experiment of Toronto's terrain
made via QGIS/Inkscape/GIMP and TIN data from Toronto Open Data
higher-res here: https://jamaps.github.io/maps/terrain-toronto_2880x1620.png
recent map experiment of Toronto's terrain
made via QGIS/Inkscape/GIMP and TIN data from Toronto Open Data
higher-res here: https://jamaps.github.io/maps/terrain-toronto_2880x1620.png
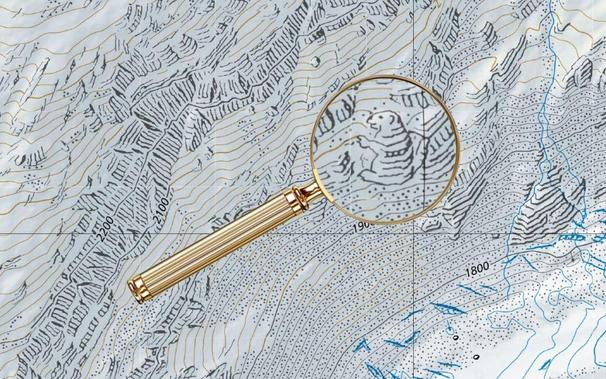
For Decades, Cartographers Have Been Hiding Covert Illustrations Inside of Switzerland’s Official Maps.
"As Juerg Gilgen, a current cartographer at Swisstopo, told me “as a matter of fact, the proof-reader is also just a human being prone to failure. And cartographers are also just human beings trying to fool around.”"
Wonderful, wonderful stuff.
#MapMaking #maps #cartography #switzerland #Swisstopo #topography #hidden #illustration #eyeondesign
Places and their names for today's #30DayMapChallenge or Topography and Toponymy.
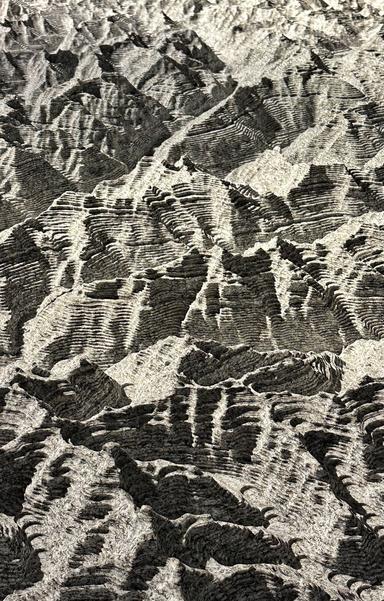
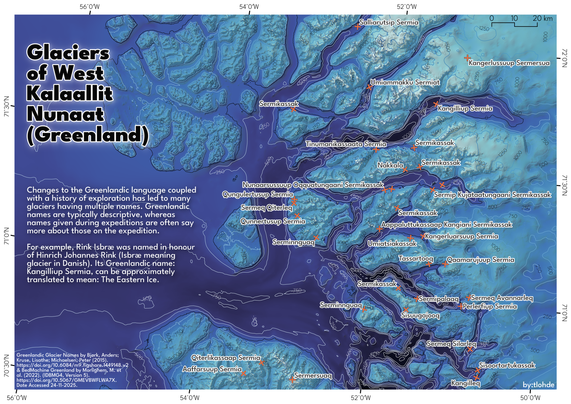
I used the #Greenland #Glacier Names dataset^[1] and BedMachine Greenland v5^[2] to show off some of the fantastic glacier names in West Greenland (Kalaallit Nunaat).
Somewhat confusingly, mostly because I wasn't thinking (it's late, y'know) I apparently decided to show the terrain sans-ice.
Made in #QGIS. Typeface: League Spartan by the League of Moveable Type
[1] Getting Greenland's glaciers right by Bjørk, A. A., Kruse, L. M., and Michaelsen, P. B. (2015) https://doi.org/10.5194/tc-9-2215-2015
[2] Morlighem, M. et al. (2022) https://doi.org/10.5067/GMEVBWFLWA7X
#topography #toponymy #maps #KangilliupSermia #NunaarsussuupOqquatungaaniSermikassak #gis #glaciology
Hype for the Future 20C: Decoding Geographic Names
New England Within the New England region is Maine, New Hampshire, Vermont, Massachusetts, Rhode Island, and Connecticut. Northern New England is Maine, New Hampshire, and Vermont, while Southern New England is Massachusetts, Rhode Island, and Connecticut. “The County” in Maine may refer to Aroostook County, and the portions of New England closest to the Québec border are often associated with an enhanced sense of rurality. Further away from the international border is Mount Katahdin, […]https://novatopflex.wordpress.com/2025/11/20/hype-for-the-future-20c-decoding-geographic-names/
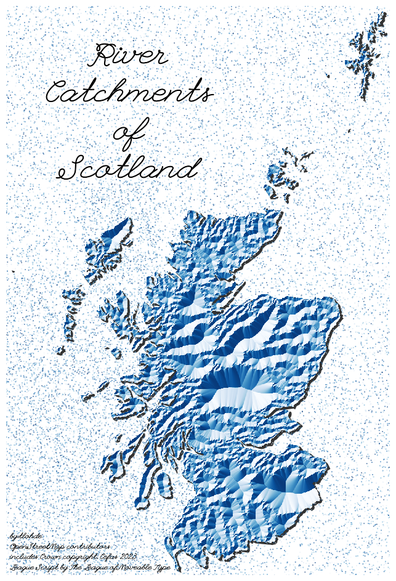
Remolding Scotland by depicting river catchments as terrain for today's #30DayMapChallenge : #water
Catchments are from Cefas, via SEPA.
Made a proximity surface* for distance to catchment boundary, then applied a hillshade to that.
*again, like a one-trick pony.
Font: League Script by The League of Moveable Type
as usual made with Python: #matplotlib, #xarray #scipy #shapely #geopandas
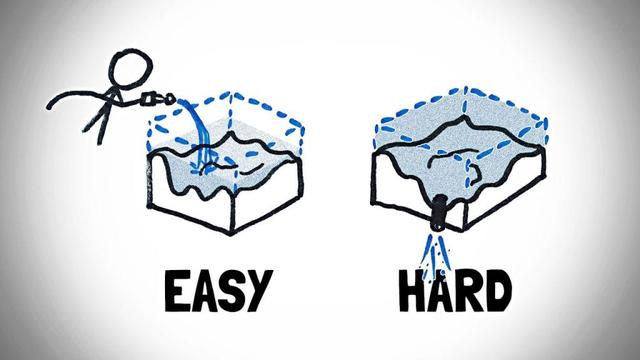
Draining Topography is Hard
At first glance, draining an ocean seems simple like a simple problem: just put a drain at the lowest point. But, as shown in this Minute Physics video, the problem is harder than it sounds because drainage depends not just on a point’s elevation but also on the path that leads to the drain. Fortunately, Henry has some clever methods for figuring out which areas would drain and how. (Video and image credit: Minute Physics)
#drainage #fluidDynamics #oceans #physics #science #topography
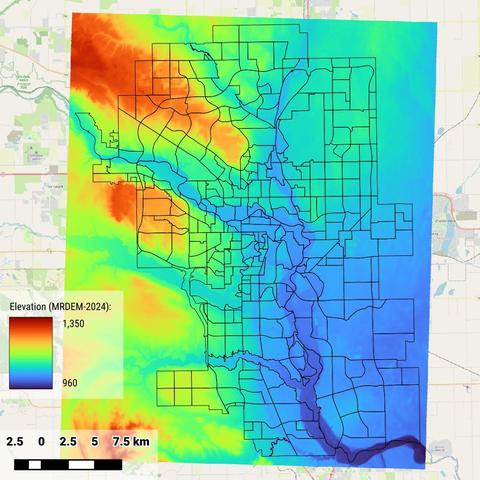
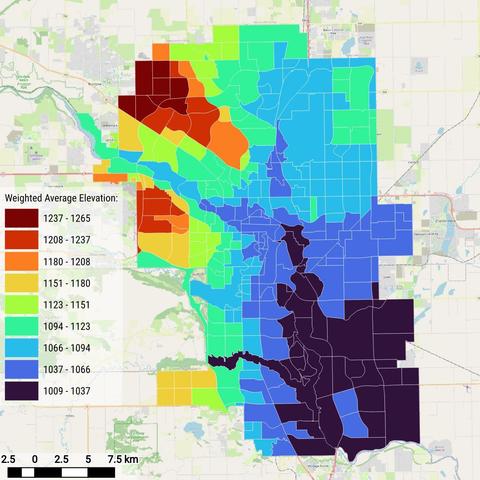
🏔️ How high is your community?
Using the MRDEM-2024 elevation model, I mapped the average elevation for each Calgary community.
The result clearly shows how the city “steps down” from the western uplands toward the Bow and Elbow River valleys in the east and south.
🔹 The highest areas — around Tuscany, Rocky Ridge, and Cougar Ridge — rise over 1,240 m above sea level.
🔹 The lowest zones — Shepard, McKenzie Towne, and parts of the southeast — drop to about 1,000 m.
It’s a great reminder that Calgary’s landscape still reflects its glacial past — a city built on terraces, slopes, and ancient river plains.
#Calgary #Alberta #Geography #Geospatial #QGIS #OpenData #UrbanGeography #DataVisualization #Topography #Geomorphology #Canada #DEM

Places and their names for today's #30DayMapChallenge or Topography and Toponymy.
I used the #Greenland #Glacier Names dataset^[1] and BedMachine Greenland v5^[2] to show off some of the fantastic glacier names in West Greenland (Kalaallit Nunaat).
Somewhat confusingly, mostly because I wasn't thinking (it's late, y'know) I apparently decided to show the terrain sans-ice.
Made in #QGIS. Typeface: League Spartan by the League of Moveable Type
[1] Getting Greenland's glaciers right by Bjørk, A. A., Kruse, L. M., and Michaelsen, P. B. (2015) https://doi.org/10.5194/tc-9-2215-2015
[2] Morlighem, M. et al. (2022) https://doi.org/10.5067/GMEVBWFLWA7X
#topography #toponymy #maps #KangilliupSermia #NunaarsussuupOqquatungaaniSermikassak #gis #glaciology