Es imposible renderizar emojis a color en #Matplotlib 🤔
En #Rstats puedes expresar las emociones con emojis
Thomas Lin Pedersen ragg #ggplot2 #tidyverse
#psicologia #UCR #python @nobodyinperson
Es imposible renderizar emojis a color en #Matplotlib 🤔
En #Rstats puedes expresar las emociones con emojis
Thomas Lin Pedersen ragg #ggplot2 #tidyverse
#psicologia #UCR #python @nobodyinperson
In the Python programming language, several libraries facilitate the creation and visualization of neural networks, with Matplotlib being one of the most popular options[..]
When AI Crosses the Line: The Matplotlib Incident
https://members.sigmazero.cc/posts/when-ai-crosses-159174096?postId=when-ai-crosses-159174096
#HackerNews #AI #Ethics #AI #Incident #Data #Visualization #Matplotlib #Technology #News
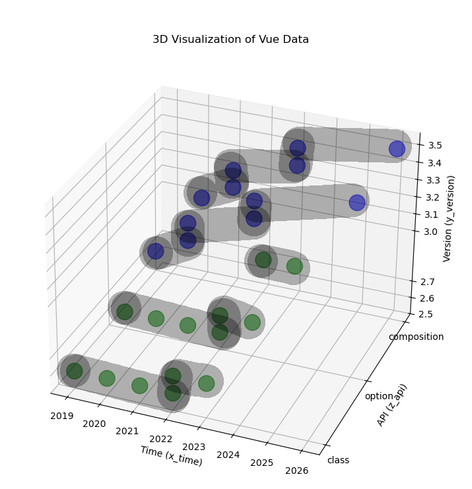
Salut, je cherche à amélioré cette vue 3D de données. Mon but ça serait de rassembler les points, les relier en une seule forme. Pour donner l’idée j’ai dessiné sur le graphique.
Pour le faire j’ai utilisé #python et #matplotlib mais si c’est possible avec d’autre outil je suis prenneur aussi.
Comment vous feriez ça ? Quel outil ?
( #boost apprécié :) )
#dataviz #datavisualization #datascience
CIAO wavdetect : X線画像の局所構造をMexican Hat waveletで検出する
https://qiita.com/ken_aizawa/items/e5875d5a789eef240e5e?utm_campaign=popular_items&utm_medium=feed&utm_source=popular_items
- I really liked the R #marginaleffects package with its data structures and plots, does this have a suitable replacement in Python?
- talking about plots, #matplotlib is still like arcane sorcery to me. Plotting is really worse in Python than in R. For quick exploration I just want hist() and then a plot pops up!
- I'm starting to like #numpy more and more
3/n
The #MatPlotLib maintainer vs vague #OpenClaw bot(?) makes my blood pressure rise.
Why this sort of behaviour specifically?
Because it was about 4 years ago that I started warning technical experts at my job about how the irresponsible release of AI software would soon waste their time.
And now it does and apparently it's seen as the new normal. No.
This is how our brains burn out, we stop caring and will start to feel lonely. People need to stop attacking each other with software that the other party has not consented to.
You can say no to the way people use or implement software that wastes your time and makes you unhappy. If they don't change their behaviour then you'll know that they are happy to remain ignorant. And you can place your boundaries accordingly.
And if you're overwhelmed by AI? Form expert groups, talk to human beings, hell, start meeting up!
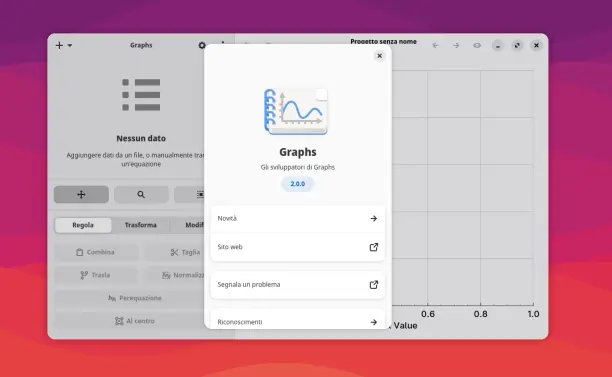
Graphs 2.0 migliora grafici scientifici, import dati, curve fitting e supporto mobile con tante novità per Linux e GNOME. #opensource #Linux #GNOME #Graphs #DataScience #Flatpak #Matplotlib #FOSS
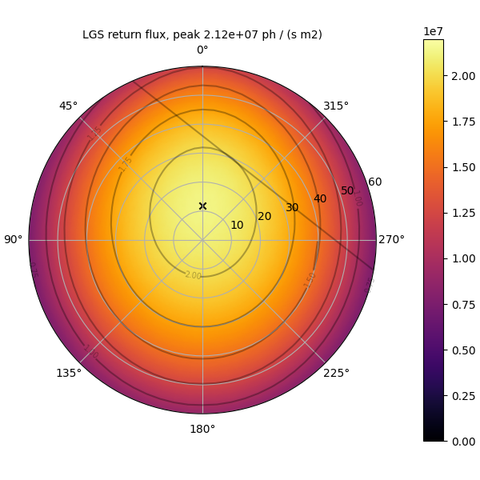
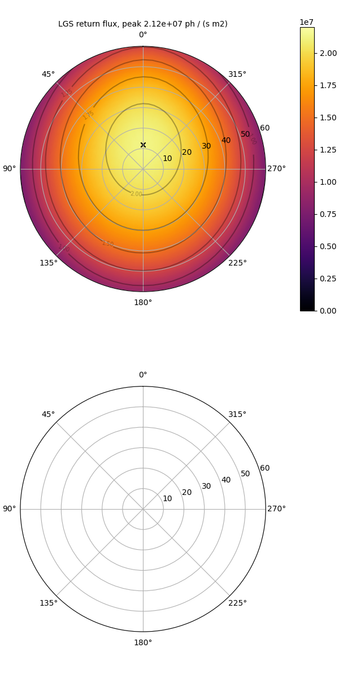
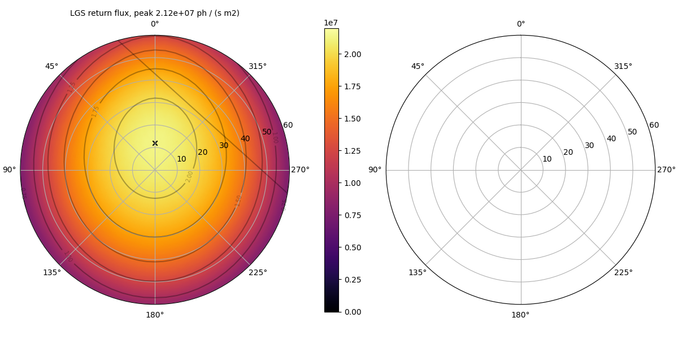
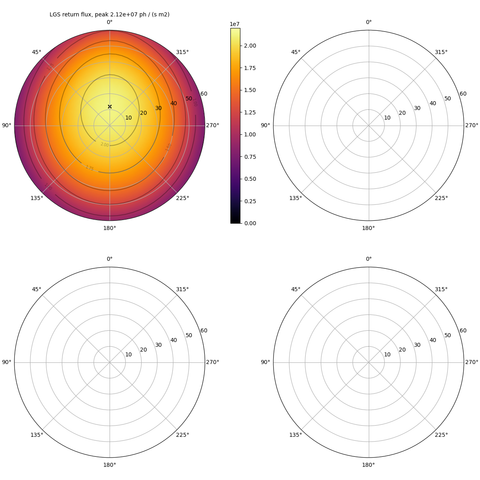
OK matplotlib, I love you, but now you're just messing with me.
When I try to put contours on the polar plot of these data it works if, and only if, the plot is part of a multiplot with at least 2 rows of axes. If I try to plot it by itself, or in a multiplot with only one row, then the contour function draws a spurious line right through it. Nothing else is different, it's exactly the same plotting code running on the same data, the only thing that I changed is the number of axes in the call to subplots().
Welp, guess I'm plotting an extra axes and then editing it out of the resulting image.
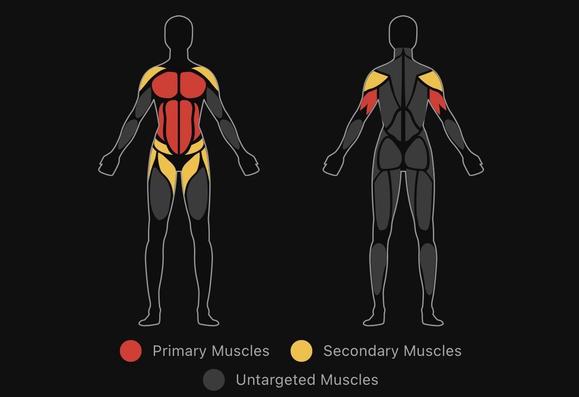
I am thinking to do a “heatmap” of the muscles of the human body using #matplotlib. The idea is to have strength workouts point at different muscles and show that dynamically using matplotlib (see image). Maybe nuts not sure yet…
I was thinking to convert the #png to #svg and then with svgpath2mpl parse it to a matplotlib path (not sure yet if I can do more than one path) :
https://petercbsmith.github.io/marker-tutorial.html
Now, is there a better/easier way?
 Qiita - 人気の記事