Compound Hydrogeomorphic Cascades And Rapid Upstream To Downstream Hazard Coupling In The Eastern Himalaya
--
https://doi.org/10.1038/s41598-026-52915-8 <-- shared paper
--
https://doi.org/10.5194/esurf-13-1281-2025 <-- shared paper
--
https://doi.org/10.1007/s11069-025-07766-3 <-- shared paper
--
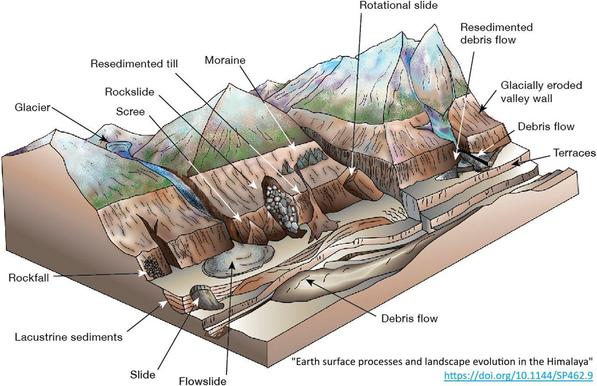
[I recognise that the photo is instead for the floods, etc in Lubra, Nepal - but felt it better showed the hydrogeomorphical setting (sic) for the 'casual' post viewer...]
H/T @Kuldeep Dutta
“In hilly regions transitioning rapidly to low gradient alluvial plains, localized hydrometeorological triggers can instantly scale into devastating basin wide disasters. This study dissects the September 2020 cascading hazard in parts of the Arunachal Pradesh-Assam corridor to quantify the rapid coupling between upstream hillslopes and downstream floodplains…”
--
“Extreme precipitation in the Eastern Himalaya is increasingly associated with coupled hillslope-floodplain hazards. This study examines the 17th-18th September 2020 rainfall event in Arunachal Pradesh initiating landslides and its downstream impacts in Assam, India, using multi-sensor satellite data and long-term rainfall records. Sentinel-2 imagery was used to map landslides and debris flows, Sentinel-1 SAR data to delineate flood extent, and IMD gridded rainfall (1996–2020) to analyse rainfall spell characteristics. The event triggered widespread slope failures, localized landslide damming, and a subsequent breach, generating sediment-laden flows that inundated ~ 100 km2 of the Dhemaji floodplain. A backscatter-derived Relative Flood Volume Index (RFVI) indicates spatial variability in inundation intensity, although it does not represent absolute flood volume. Rainfall analysis suggests that antecedent wetness from preceding spells preconditioned slopes, while peak daily rainfall (> 170 mm/day/) initiated landsliding. Power-law scaling shows negligible dependence of intensity on duration (R² ≈ 0.0004), whereas cumulative rainfall exhibits a stronger relationship with duration (R² ≈ 0.54). These results indicate distinct roles of rainfall intensity and accumulation in controlling landslide initiation and downstream flooding, respectively, highlighting the importance of compound rainfall forcing in rapid hydrogeomorphic cascades...”
#EarthScience #RemoteSensing #Himalayas #NaturalHazards #ClimateChange #ScientificReports #GeospatialAnalysis #DisasterMitigation #Landslide #Flooding #alluvial #fluvial #water #hydrology #hydrography #flood #flooding #spatialanalysis #spatiotemporal #mountain #plain #hydrometeorological #hydrogeomorphology #ArunachalPradesh #Assam #India #hillslope #floodplain #rainfall #precipitation #extremeweather #engineeringgeology #massmovement #landslide #debrisflow #risk #hazard #monitoring #GIS #spatial #mapping #remotesensing #satellite #Sentinel #sedimentation #humanimpacts #infrastructure #damage #cost #economics #public #safety #model #modeling #downstream