☀️ Albedo vs. Surface Temperature: Why a "Bright" City Isn't Always Cooler

❗ Key findings from the current stage of research:
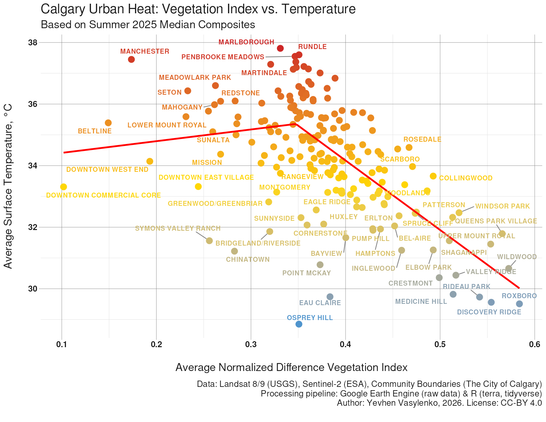
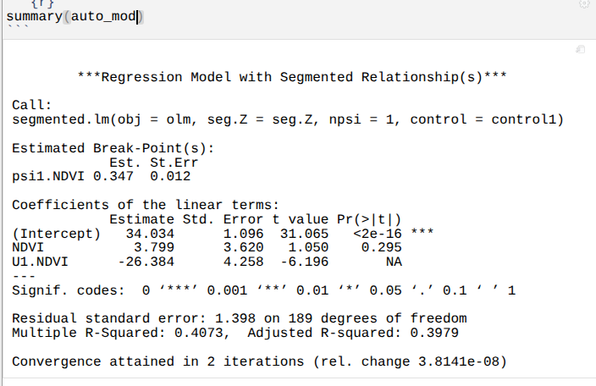
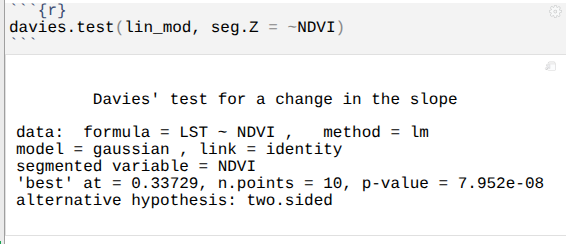
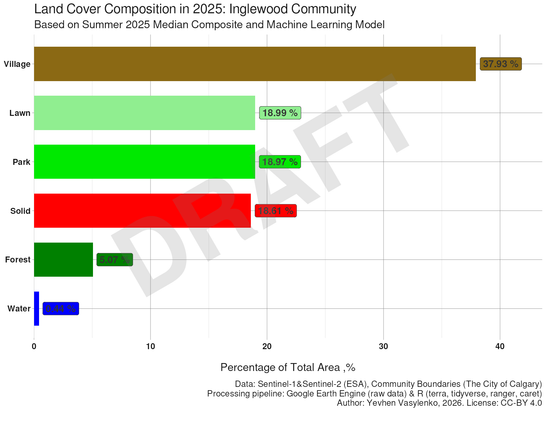
🔹 Vegetation (NDVI): Based on modeling results, biomass health accounted for approximately 40% of the variance in Calgary’s temperature regime in 2025.
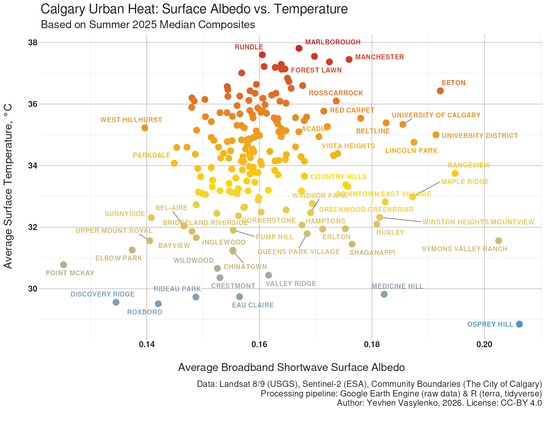
🔹 Albedo (Reflectance): While it is commonly assumed that high surface reflectance reduces heat absorption, satellite data (broadband shortwave albedo) reveals a far more nuanced picture.
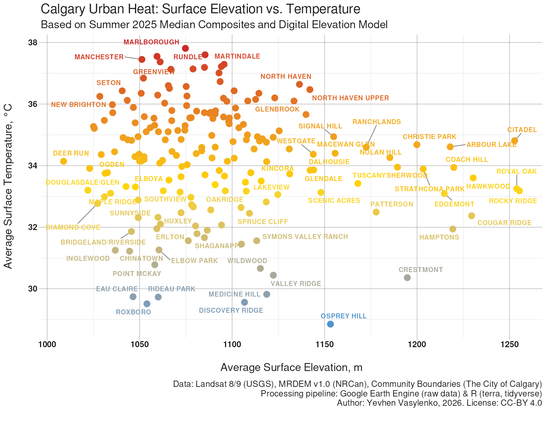
🔥 The Seton Anomaly
The scatter plot clearly shows a wide distribution of values. The community of Seton is a particularly striking example: despite its high average albedo (likely due to light-colored soils at construction sites and new roofing materials), the area remains in a "heat zone" (classified as Warm Background in my model).

❗ Albedo plays a role, but it is not the dominant factor in Calgary’s environment.

#Calgary #UrbanHeat #DataScience #ClimateResilience #YYC #Geoscience #CityPlanning #RemoteSensing #RStats #APEGA #GreennesOfCalgary

🌿 Can trees cool #Calgary ? Summer 2025 data from 193 neighborhoods reveals a tipping point: 0.34 NDVI.
🔹 Below 0.34: Isolated trees in "concrete jungles" provide ~0 cooling ROI.
🔹 Above 0.34: Cooling "clicks in" & efficiency jumps.
Stats: Vegetation explains 40% of heat; 60% is locked in asphalt & design. Where we can't plant, we must use high-albedo materials.
Validated by Davies test. Part of my broader #YYC microclimate suite.

Link to the previous stage of research:
https://www.datastory.org.ua/calgarys-summer-heat-a-2025-satellite-perspective/

#DataScience #ClimateAction #RemoteSensing #RStats #GreennesOfCalgary #Alberta #Calgary #fossgis #ClimateSolutions

It is a common belief that higher elevations are naturally cooler. In pristine landscapes, this rule holds firm. But what about urban environments? Humanity moves vast amounts of matter and energy, sometimes fundamentally altering the thermodynamic parameters of our habitat.

🛰️ I correlated summer Land Surface Temperature (LST) data across Calgary’s neighborhoods with the Canadian Medium-Resolution Digital Elevation Model (MRDEM). The chart below illustrates the relationship between "Average Elevation" and "Average Surface Temperature" specifically for established residential communities. As observed, this relationship is notably weak, even though a slight cooling trend persists. Based on my data analysis, elevation above sea level is not a key factor in cooling the city.

#Calgary #OpenData #UrbanHeat #DataScience #ClimateAction #YYC #GreennesOfCalgary #ClimateEquity #EnvironmentalEquity #CityPlanning #RemoteSensing #RStats #Landsat #fossgis #DigitalElevationModel

💻 I took several completely independent datasets and "pitted" them against each other. One of the results is shown in this chart: the more "concrete" (roads, buildings, parking lots) my machine learning model identified in a community, the higher the surface temperature recorded by the thermal sensor.

🔥 The result: Data from different sources confirm one another. The difference in surface temperature between "green" and "concrete" residential areas averages 8–10°C throughout the summer. On certain days, this gap is likely even wider.

📉 This chart shows only established residential communities. If industrial zones were included, the trend would be even more dramatic. While modeling errors certainly exist, the overall physical pattern is undeniable.

#Calgary #OpenData #UrbanHeat #LULC #DataScience #ClimateAction #YYC #GreennesOfCalgary #ClimateEquity #EnvironmentalEquity #CityPlanning #MachineLearning #RemoteSensing #RStats #Sentinel1 #Sentinel2 #Landsat #fossgis

🛰️ This is an RGB composite of derived metrics from Calgary satellite imagery at a 10x10m resolution. Extracting these additional urban environmental indicators significantly enhances the quality of data analysis and, consequently, the decisions based on it. Currently, one version of my Tree Canopy model has achieved 96.8% accuracy, a testament to the high precision of the methodology.

💻 I am now retraining the machine learning model to move beyond analyzing Calgary in large blocks and focus on every individual yard. This will allow us to account for not only large forest patches but also, where possible, every mature tree in the city — including those behind your fence or right under your window. These residential trees are what provide the shade, comfort, and fresh air we all enjoy. My goal is to ensure the final assessment reflects the contribution of every single tree to our environmental quality.

#Calgary #yyc #TreeCanopy #GIS #DataScience #GreennesOfCalgary #UrbanEcology

🌳 I am finalizing a tool that allows for a rapid and accurate assessment of the green infrastructure in any Calgary community. This isn't just "green color" on a map—my algorithm recognizes the differences in the quality and structure of the urban environment.

What we can quantify right now:
🔹 Lawn (Grasses, low shrubs): Open spaces that tend to dry out and heat up quickly during summer.
🔹 Park (Sparse Canopy): Scattered groups of trees in parks and private yards.
🔹 Forest (Dense Canopy): The "lungs" of a neighborhood, characterized by closed canopies and thick undergrowth. These areas provide vital protection against urban heat.

❗ Why does this matter?
Using Inglewood as an example (see the chart), we can see that "dense forest" covers only about 5% of the area. This is a critical indicator of the territory's climate resilience.

#Calgary #UrbanForestry #CityPlanning #DataScience #Inglewood #CalgaryEnvironment #GIS #RemoteSensing #MachineLearning #Inglewood #Rstats #GreennesOfCalgary #YYC #yycPlanning

How hot was Calgary's neighborhood in 2025? 🛰️🌡️

I processed satellite data from last summer to see how Calgary’s communities handle the heat. It turns out that not all greenery is equal. My research shows a clear "breakpoint" where the density of vegetation actually starts to drop the surface temperature.

I’ve mapped the "Hottest" and "Coolest" communities — see where yours stands and why some "green" areas are still overheating.

Full article and maps here:
https://www.datastory.org.ua/calgarys-summer-heat-a-2025-satellite-perspective/

#RemoteSensing #Rstats #GreennesOfCalgary #ClimateOfCalgary #OpenData #FOSSGIS #ClimateResilence #Landsat #Sentinel2 #Calgary #Alberta #Canada #YYC #LST #NDVI

❗ Why "Copy-Paste" Fails in Science: Calibrating the Model for Calgary

🛰️ I’ve recently updated the land cover data for Calgary using my Proprietary MDEM Framework (Multi-dimensional Environmental Matrix).
Here’s an interesting technical challenge: the methodology that worked flawlessly on data from Kryvyi Rih, Ukraine, required significant recalibration for Alberta. Spectral signatures of Canadian spruce and local soil compositions are worlds apart from Eastern European environments.

💻 I am currently refining the local training set to ensure precise differentiation between vegetation types. This level of accuracy is vital for effective urban monitoring and improving the quality of life in our communities.

🌲 The preliminary classification results already offer a fresh, data-driven perspective on the city’s structure. The work continues!

#DataScience #Geospatial #CalgaryClimate #EnvironmentalAudit #APEGA #RemoteSensing #Calgary #GreennesOfCalgary #YYC