I like to verify my remote-sensing results directly in the field. Besides basic self-validation, field walks often generate new ideas and hypotheses.

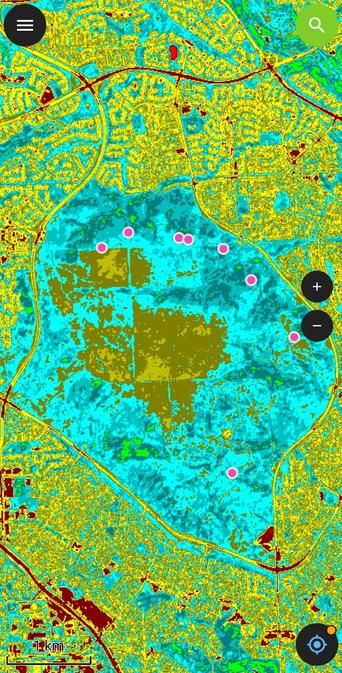
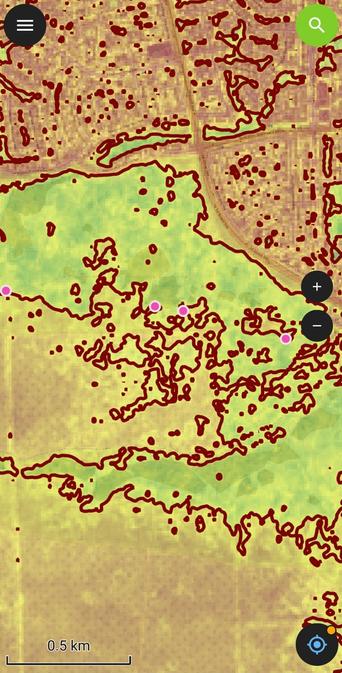
For mobile field GIS, I use QField, loading both final map layers and custom templates for data collection.
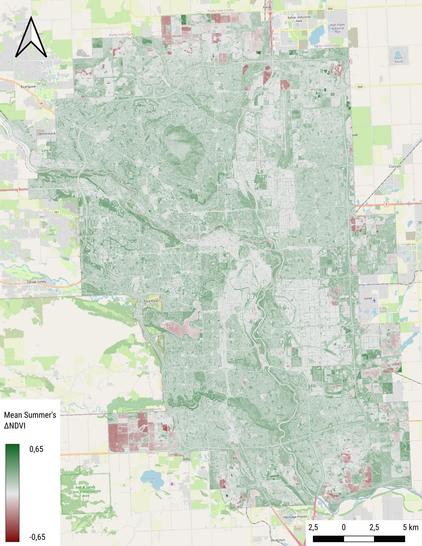
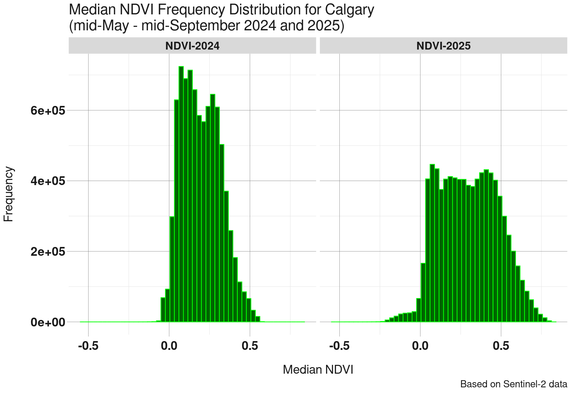
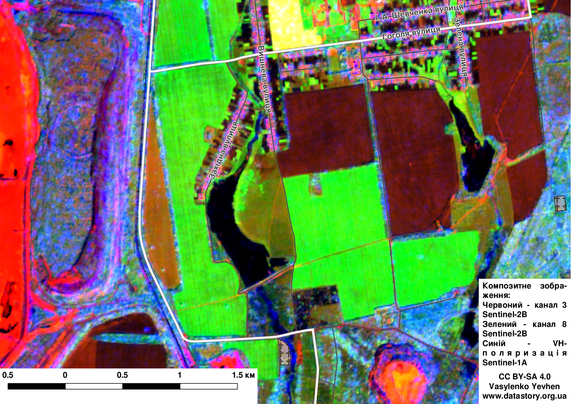
Here’s an example from Nose Hill Park, where I checked several locations that showed a consistent NDVI increase in 2025 compared to 2024.
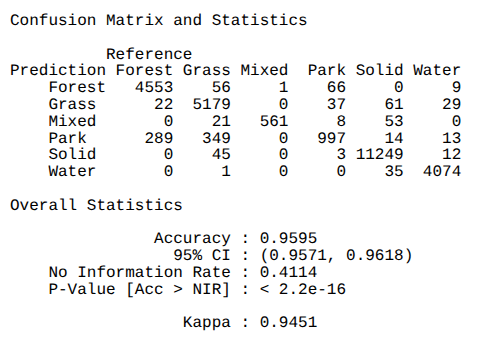
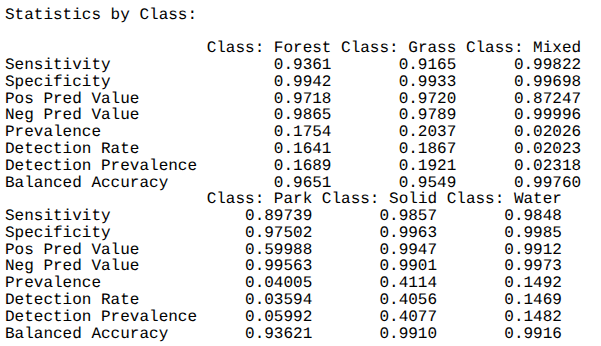
Field observations help confirm whether the spectral trends match real vegetation changes on the ground.

#RemoteSensing #EarthObservation #GIS #QGIS #QField #NDVI #VegetationMonitoring #Sentinel2 #FieldWork #GeoSpatial #OpenData #GeoDataScience #UrbanEcology #Calgary #NoseHillPark #Alberta #Canada #Copernicus #CopernicusSentinel #GreennessOfCalgary

Nose Hill Park, Calgary
Median composite of Sentinel-2 imagery (mid-May to mid-September 2025).
Band combination: 12-8-3, emphasizing substrate contrasts, vegetation structure, and moisture patterns.

#RemoteSensing #EarthObservation #Sentinel2 #OpenData #GIS #QGIS #GeoDataArt #GeoSpectralArt #Calgary #Alberta #UrbanEcology #GeospatialAnalysis #Canada #GreennessOfCalgary #Copernicus #CopernicusSentinel #NoseHillPark

Result of a Principal Component Analysis (PCA) created from combined median composites of Sentinel-1 and Sentinel-2 imagery — somewhere in the Sudanese desert.

This PCA composite brings out contrasts between lithologies, structural domains, drainage patterns, and surface materials, highlighting features that are nearly invisible in standard RGB representations.

And yes — it also happens to look stunning.

#RemoteSensing #EarthObservation #Geology #PCA #Sentinel1 #Sentinel2 #SAR #Radar #OpenData #GIS #QGIS #Geomorphology #Geoscience #SAGAGIS #RStats #Desert #Lithology #GeoDataArt #GeoSpectralArt #Sudan #Copernicus #CopernicusSentinel

Here is the city-wide map of ΔNDVI for Calgary — the difference between the median summer NDVI (mid-May to mid-September) in 2024 vs 2025.

As in the previous post, the signal is quite clear:
2025 shows a systematic increase in vegetation index across almost the entire city, but some areas showing a decrease.

This pattern is consistent with what I see in the frequency distributions of median NDVI:
2025 has a broader, greener distribution — likely reflecting better moisture conditions and a more favourable growing season.

Working with ΔNDVI on a pixel-by-pixel scale (10 × 10 m) offers a much more detailed picture of how vegetation responds spatially, compared with community-level averages or city-wide summaries.

#NDVI #Sentinel2 #RemoteSensing #Calgary #GreennessOfCalgary #GIS #Rstats #DataAnalysis #ESA #UrbanEcology #Copernicus #CopernicusSentinel #SustainableDevelopment #SustainableUrbanDevelopment #Alberta #Canada #EnvironmentalMonitoring #GIS #Geospatial

🌿 A noticeable shift in the statistical distribution of median NDVI values for Calgary between 2024 and 2025.

🛰️ Both histograms are based on Sentinel-2 data with 10×10 m resolution, and each NDVI value represents the median for mid-May to mid-September.

The contrast is striking:

🔥 2024 shows a distribution shifted toward lower NDVI values → drier summer, weaker vegetation growth, more heat-stress periods.
🏡 2025 is clearly shifted to the right → stronger greenness, more moisture, and more stable summer conditions.

This kind of interannual comparison reveals how much the city’s ecosystems can vary from year to year — using nothing more than open satellite data and clean statistics.

#NDVI #Sentinel2 #RemoteSensing #Calgary #GreennessOfCalgary #GIS #Rstats #DataAnalysis #ESA #UrbanEcology #Copernicus #CopernicusSentinel #SustainableDevelopment #SustainableUrbanDevelopment #Alberta #Canada

My experiment with land-cover classification for Calgary using satellite imagery and with a machine-learning model trained on data from another continent.

The results turned out surprisingly good — most classes transferred almost perfectly.
The only noticeable shift was the Forest class: tree and shrub vegetation in the source region differs from Calgary’s, so the model mapped it conservatively here.

Still, the general structure of the landscape was captured very well, and community-level land-cover profiles look consistent.

#Rstats #RemoteSensing #GIS #MachineLearning #LandCover #Calgary #EarthObservation #LULC #GreennessOfCalgary #QGIS #UrbanHealth #Alberta #Canada #Sentinel #Copernicus #CopernicusSentinel #Sentinel1 #Sentinel2 #ESA #DataScience #FOSS #UrbanEcology #UrbanNature

🛰️ One of my favorite RGB composites from Sentinel imagery!

This visualization combines:
🔴 Red — Sentinel-2 band 3
🟢 Green — Sentinel-2 band 8
🔵 Blue — Sentinel-1 VH polarization

Besides looking beautiful, this blend makes it easy to distinguish volumetric vegetation (trees) from flat vegetation (grasslands), and to identify subtle patterns of surface roughness and moisture variation.

It’s where remote sensing becomes both science and art. 🌍✨

#RemoteSensing #Sentinel #Copernicus #Geospatial #RSData #EarthObservation #DataVisualization #SAR #OpenScience #QGIS #CopernicusSentinel

🛰️ Land-cover classification with Sentinel-1 & Sentinel-2 — validated and working

My machine-learning model for land-cover classification has shown very high accuracy (both overall and per-class).
It was trained on multi-temporal Sentinel-1/2 data over one of Ukraine’s largest mining and industrial areas.

The model now serves as a base for analysing environmental dynamics and supporting real-world sustainability decisions.
Bridging #RemoteSensing with #EnvironmentalData and #GeospatialAnalytics — where research meets practice.

#MachineLearning #EarthObservation #GIS #DataScience #EnvironmentalMonitoring #Sustainability #OpenScience #Ukraine #RStats #LandCover #Copernicus #CopernicusSentinel

Europe says it leads the world in Earth Observation. But what is it?

Europe took another step towards cementing its position as a global leader in space-based climate monitoring, with the successful launch of its Ariane 6 rocket carrying a new weather and climate satellite into orbit.

What is Earth observation and why does it matter?

https://mediafaro.org/article/20250813-europe-says-it-leads-the-world-in-earth-observation-but-what-is-it?mf_channel=mastodon&action=forward

#Ariane6 #EU #Space #EarthObservation #Satellite #CopernicusSentinel #Science #Europe #Climate #Europe

Europe says it leads the world in Earth Observation. But what is it?

Europe took another step towards cementing its position as a global leader in space-based climate monitoring, with the successful launch of its Ariane 6 rocket carrying a new weather and …

Euronews
Satellites Copernicus : gendarmes bienveillants des océans. Protéger nos mers devient collectif, transparent, nécessaire.
https://www.lepoint.fr/environnement/comment-les-satellites-deviennent-des-gendarmes-de-l-ocean-30-07-2025-2595433_1927.php
#Space #Science #CopernicusSentinel #OceanProtection #UNOC3
Comment les satellites deviennent des gendarmes de l’océan

L’Agence spatiale européenne dispose d’une flotte de satellites capables de détecter et d’identifier les navires pollueurs depuis l’espace.

Le Point