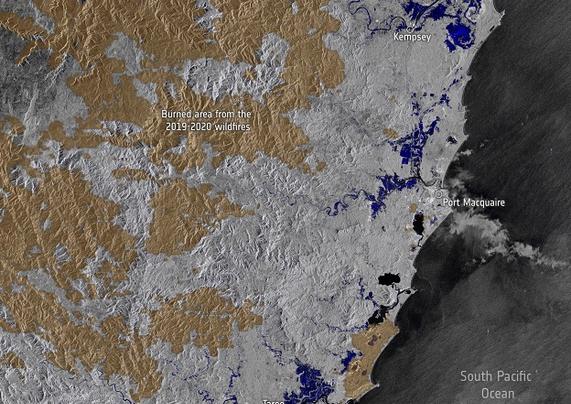
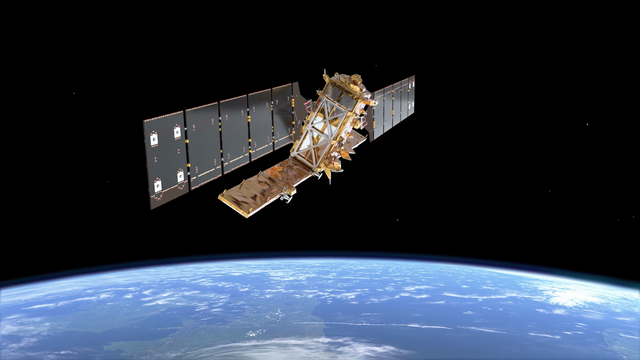
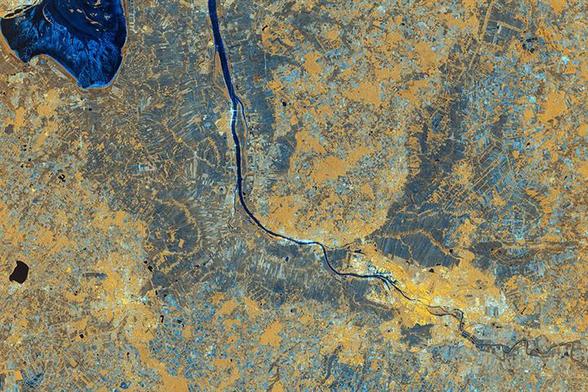
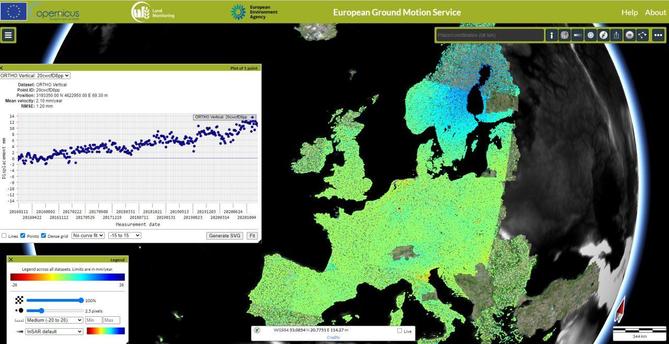
📌 🗺️ This map illustrates the #flood extent derived from #Sentinel1 #imagery acquired on JAN-23 2026 #mozambique

🔹 Within the analysed area of approx 43,500 km², an estimated 3,000 km² of land appears to be affected by floodwaters

🔹 Based on WorldPop spatial demographic #data, approx 230,000 people are exposed to or living in close proximity to the flooded areas

#emergencyresponse #mapping
#civilprotection #esa #research

Source 🔵 UN / UNOSAT #africa

https://unosat.org/products/4230

UNOSAT

Alarmstufe Rot am Jakobshavn-Gletscher
Satellitendaten zeigen schnellen Eisabfluss des größten Gletschers Grönlands

In diesem Bild ist einer der größten und am schnellsten strömenden #Gletscher Grönlands zu sehen. Die Aufnahme des europäischen Satelliten #Sentinel1 zeigt den #JakobshavnIsbræ an der Westküste #Grönland's. Das Einzugsgebiet dieses Eisstroms umfasst etwa 110.000 Quadratkilometer – dies entspricht 6,5 Prozent des grönländischen Eisschilds. Von der riesigen Gletscherfront des Jakobshavn kalben mehr #Eisberge als von jedem anderen Küstengletscher Grönlands. Auch der Eisberg, der 1912 die #Titanic versenkte, stammte wahrscheinlich vom Jakobshavn-Gletscher.

Wegen seiner enormen Eismassen und schnellen Veränderung steht der Jakobshavn-Gletscher unter ständiger Beobachtung: In regelmäßigen Abständen wird seine Oberfläche von den Satelliten der Copernicus Sentinel-1-Mission abgetastet und kartiert. Dies hat es Forschenden ermöglicht, die Geschwindigkeit dieses Eisstroms und weiterer Gletscher Grönlands in den letzten zehn Jahren genauer zu bestimmen.

Die Farben in dieser Aufnahme verdeutlichen die Resultate der Satellitenmessungen. Demnach fließt das Eis in den weißlich-violett markierten Bereichen des Jakobshavn-Gletschers mit bis zu 50 Meter pro Tag in Richtung Meer. In den roten Bereichen sind es immerhin noch zwischen einem und zehn Meter pro Tag.

https://www.scinexx.de/fotos/alarmstufe-rot-am-jakobshavn-gletscher/

#Klimakatastrophe
#Kryosphäre

Sentinel-1's decade of essential data over shifting ice sheets

Ice velocity is a key parameter in measuring the effects of #ClimateChange. The speed at which #glaciers and #IceSheets move tells us the rate at which they discharge ice and water into the sea, feeding into estimations on future #SeaLevelRise. Data on ice velocity also help to keep track of the break-up of ice sheets, such as calving events or damage to the ice sheets.
Since its first satellite was launched in 2014, the #Copernicus #Sentinel1 mission has provided a step change in the capabilities of polar satellite Earth observation. Its 12-m-long advanced #SAR instrument works in C-band. This makes it a reliable tool for acquiring high-resolution imagery for continuous monitoring and emergency response efforts. It is able to capture data through cloud cover, smoke and during lack of sunlight.

https://phys.org/news/2026-01-sentinel-decade-essential-shifting-ice.html

#ClimateScience
#RemoteSensing
#Cryosphere
#ClimateCatastrophe

Today is #WorldSoilDay so I thought I'd share an animation of Winter Hill in the West Pennine Moors. This illustrates how #Sentinel1 #SAR satellite data can be used to delineate #peatland condition.
Turquoise denotes wetter peatland, drier areas are in brown.
Our research found frozen conditions to better differentiate peatland from other land cover & highlight relative condition. Check it out here
https://www.mdpi.com/2072-4292/17/16/2752
All with the power of #qgis #remotesensing #earthobservation #mapping

#ESA:
"
Sentinel-1D delivers first images: from Antarctica to Bremen
"
"Glaciers in Antarctica, the tip of South America, as well as the city of Bremen, .. visible in .. radar images."
".. the satellite and its instruments – it carries a 12 m-long synthetic aperture radar (SAR) instrument – were switched on .."

https://www.esa.int/Applications/Observing_the_Earth/Copernicus/Sentinel-1/Sentinel-1D_delivers_first_images_from_Antarctica_to_Bremen

26.11.2025

#Bremen #Copernicus #Elbe #EO #Erdbeobachtung #Fernerkundung #GMES #Matera #Radar #Raumfahrt #SAR #Satelliten #Sentinel1D #Sentinel1 #SpaceFlight

Sentinel-1D delivers first images: from Antarctica to Bremen

The first high-resolution images have been received from Copernicus Sentinel-1D and were shared publicly for the first time at the European Space Agency’s Ministerial Council, held today in Bremen, Germany. Glaciers in Antarctica, the tip of South America, as well as the city of Bremen, are visible in these stunning radar images.

Result of a Principal Component Analysis (PCA) created from combined median composites of Sentinel-1 and Sentinel-2 imagery — somewhere in the Sudanese desert.

This PCA composite brings out contrasts between lithologies, structural domains, drainage patterns, and surface materials, highlighting features that are nearly invisible in standard RGB representations.

And yes — it also happens to look stunning.

#RemoteSensing #EarthObservation #Geology #PCA #Sentinel1 #Sentinel2 #SAR #Radar #OpenData #GIS #QGIS #Geomorphology #Geoscience #SAGAGIS #RStats #Desert #Lithology #GeoDataArt #GeoSpectralArt #Sudan #Copernicus #CopernicusSentinel

#Copernicus Image of the day
Offshore wind farms in the North Sea

Credit: European Union, Copernicus Sentinel-1 imagery

Source: https://www.copernicus.eu/en/media/image-day-gallery/offshore-wind-farms-north-sea

#Sentinel1 #EU #EarthObservation

Result of a Principal Component Analysis (PCA) based on combined median composites of Sentinel-1 and Sentinel-2 satellite imagery — somewhere in the desert of Sudan.

The PCA highlights contrasts between different lithologies, structural domains, and surface materials, revealing subtle geological features that are hard to distinguish in standard RGB composites.

And yes — it also looks simply beautiful.

#RemoteSensing #EarthObservation #Geology #PCA #Sentinel1 #Sentinel2 #Radar #OpenData #GIS #QGIS #Geomorphology #Geoscience #SAR #SAGAGIS #RStats #Desert #Lithology #GeoDataArt #GeoSpectralArt

Day15 #30daymapchallenge is Fire 🔥
My map is a gif of #Sentinel1 images before & after the #wildfire at Winter Hill in the West Pennine Moors, UK in 2018.
The dashed line shows the extent of the fire, which burned on dry #peatland for over 40 days.
The colour range from blue to orange symbolises how radar backscatter represents water bodies/wetter surfaces through to dry, impermeable land cover & demonstrates the positive effects of #peatlandrestoration works since the fire.
All using #qgis

My experiment with land-cover classification for Calgary using satellite imagery and with a machine-learning model trained on data from another continent.

The results turned out surprisingly good — most classes transferred almost perfectly.
The only noticeable shift was the Forest class: tree and shrub vegetation in the source region differs from Calgary’s, so the model mapped it conservatively here.

Still, the general structure of the landscape was captured very well, and community-level land-cover profiles look consistent.

#Rstats #RemoteSensing #GIS #MachineLearning #LandCover #Calgary #EarthObservation #LULC #GreennessOfCalgary #QGIS #UrbanHealth #Alberta #Canada #Sentinel #Copernicus #CopernicusSentinel #Sentinel1 #Sentinel2 #ESA #DataScience #FOSS #UrbanEcology #UrbanNature