#statstab #547 Statistical inference for exploratory data analysis and model diagnostics
Thoughts: A rather odd and provocative article. Taking visual inference to its limit.
#exploratory #eda #plots #Rorschach #inference #simulation #lineups
#statstab #547 Statistical inference for exploratory data analysis and model diagnostics
Thoughts: A rather odd and provocative article. Taking visual inference to its limit.
#exploratory #eda #plots #Rorschach #inference #simulation #lineups
#statstab #541 Titles & Captions: Adding Context to Your Plots
Thoughts: A good plot can showcase your entire paper. Normalise plotting effects of interest!

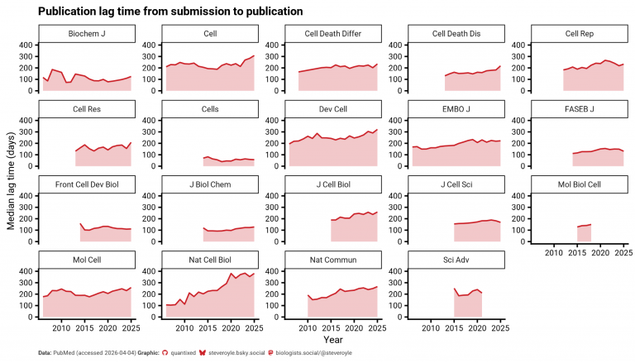
Hold On Hope: publication lag times at cell biology journals
https://quantixed.org/2026/04/09/hold-on-hope-publication-lag-times-at-cell-biology-journals/
#publishing #dataviz #LagTimes #metrics #papers #plots #PubMed #Rstats
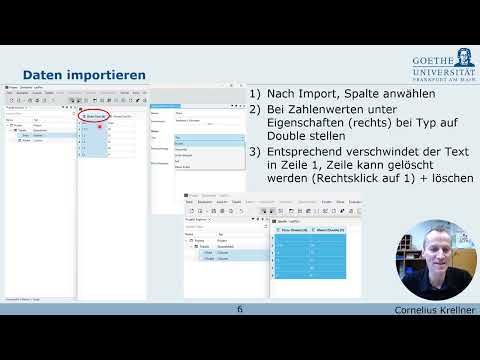
Einführung in #LabPlot (2.12.1) – ein Video-Tutorial, erstellt von der KML der Universität Frankfurt (Prof. Dr. Cornelius Krellner).
https://www.youtube.com/watch?v=POR3wldhRx4
#LabPlot #OpenSource #FOSS #FLOSS #DataVisualization #DataAnalysis #Statistics #Plots #Physics #Chemistry #EU
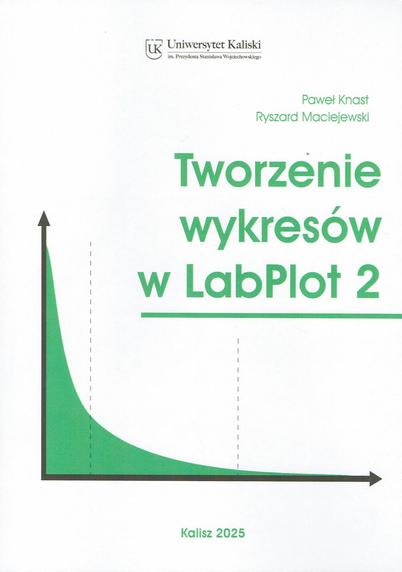
A book in Polish titled "Creating Graphs in LabPlot 2" by Paweł Knast and Ryszard Maciejewski has been published. Kalisz, 2025.
Na rynku wydawniczym pojawiła się książka w języku polskim pt. "Tworzenie wykresów w LabPlot 2" Pawła Knasta i Ryszarda Maciejewskiego. Kalisz 2025.
👉 https://w.bibliotece.pl/7469025/Tworzenie%20wykres%C3%B3w%20w%20LabPlot2
#LabPlot #OpenSource #FOSS #FLOSS #DataVisualization #DataAnalysis #Statistics #Plots
Visualization
This is a spottily-updated list of miscellaneous resources I’ve come across dealing with data visualization in several forms.(...)
#charting #charts #data #graphics #graphs #mathematics #plots #plotting #statistics
https://taoofmac.com/space/infoviz?utm_content=atom&utm_source=mastodon&utm_medium=social

Working with large #projects can get messy—especially when dependencies between #spreadsheets, #formulas, or #plots aren’t clear. That’s why we’ve implemented a simple solution to track #data dependencies, so you can: 
➡️ Spot errors faster – See how changes in one sheet impact others.
➡️ Save time – No more manual tracing of formulas or references.
@[email protected]
@opensource
#FreeSoftware #OpenSource #FLOSS #FOSS #DataAnalysis #DataViz #Productivity #Tech #Science #Statistics #InfoSec