
Highlight a certain aspect of your data in ggplot: https://yutannihilation.github.io/gghighlight/ #rstats #dataviz
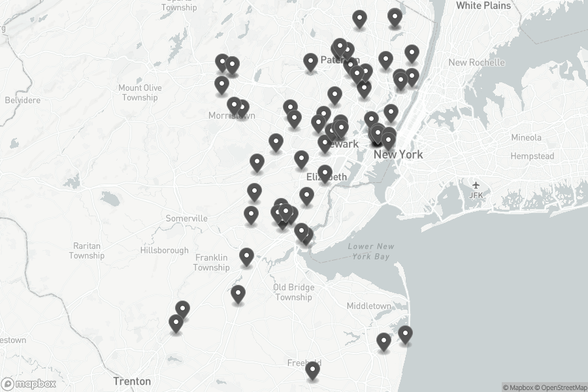
Map of Accredited NJ Career and Technical Institutions
Source: https://data.nj.gov/d/jmk4-knzi
#nj #data #dataviz
Source: https://data.nj.gov/d/jmk4-knzi
#nj #data #dataviz
https://www.fogolf.com/1263455/liv-golf-seeking-up-to-350-million-in-capital-raise/ LIV Golf Seeking Up to $350 Million in Capital Raise #BrysonDeChambeau #DataViz #Golf #GolfNews #JonRahm #LivGolf #PgaTour


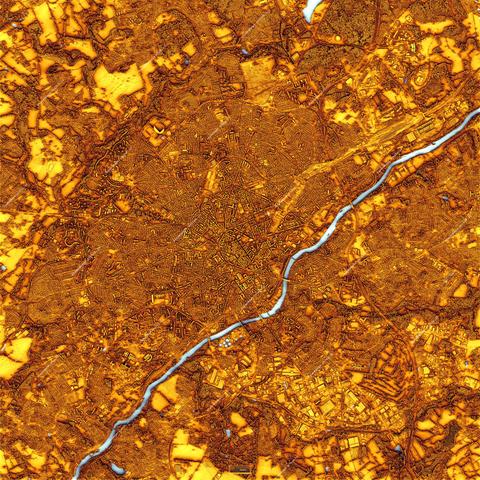
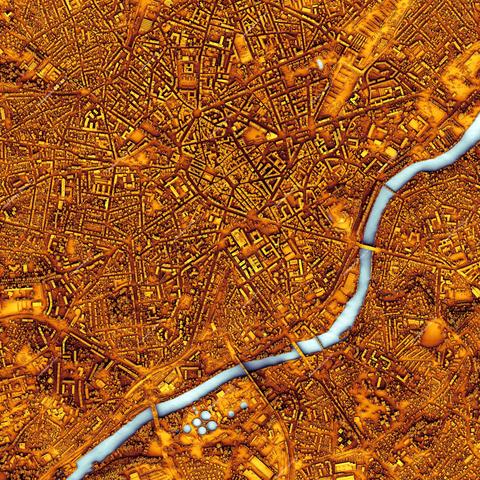
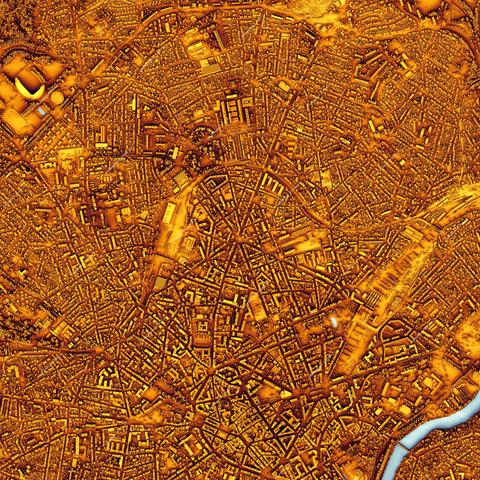
A very detailed shaded map of Limoges, France. The full map is 16000 x 16000 pixels with 0.5 m resolution and is available at https://shadedmaps.github.io
Data source: https://geoservices.ign.fr/lidarhd [Institut national de l'information géographique et forestière].
#lidar #gischat #dataviz #geography #GIS
Data source: https://geoservices.ign.fr/lidarhd [Institut national de l'information géographique et forestière].
#lidar #gischat #dataviz #geography #GIS
Managed to get {ggchord2} working with {ggiraph} so you can* have interactive chord diagrams with tooltips!
*currently a bit hacky but technically does work
Example: https://nrennie.rbind.io/data-viz-projects/local-council-elections/
This example is a remake of a Sankey chart published by YouGov today in this article: https://yougov.com/en-gb/articles/54811-labours-voter-coalition-broke-more-to-left-than-right-at-2026-local-elections
Original Sankey chart: https://flo.uri.sh/visualisation/29040587/embed
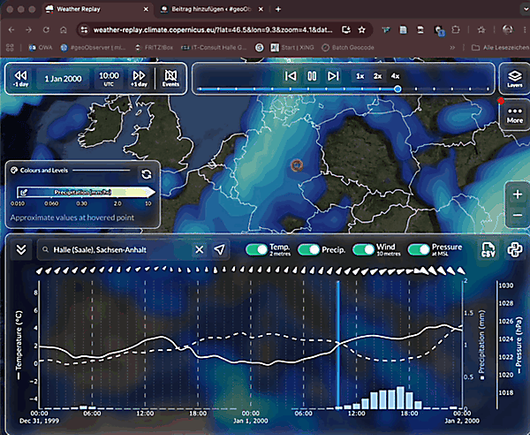
Weather Replay: Historisches Wetter ab 1940 visualisieren / Visualising historical weather data from 1940 onwards https://geoobserver.de/2026/05/21/weather-replay-historisches-wetter-ab-1940-visualisieren/ via @galeanodavid #gistribe #gischat #fossgis #foss4g #OSGeo #spatial #geospatial #DataViz #gis #geo #geoObserver pls RT
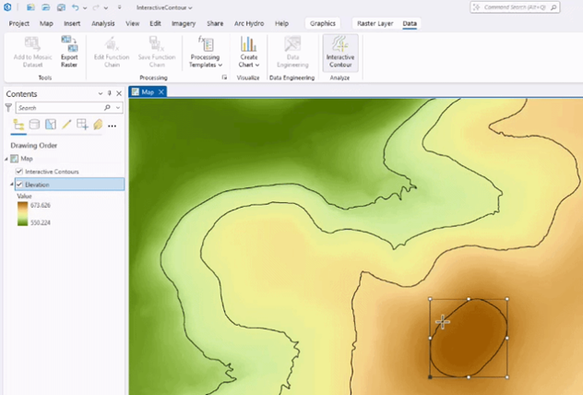
Visualize #rasters with Interactive Contour in #ArcGISPro https://tinyurl.com/yecsrykp
#imagery #terrain #dataviz #GIS #esri #arcgis #mapping #GISchat #geospatial @esri @arcgispro @esrifederalgovt @esrislgov @esritraining @urisa
Where on the #fediverse can you post some about #statistics, #dataviz, #rstats, and also about birds, equity, and social justice, and other topics du jour? I'm not topical enough for my current server...