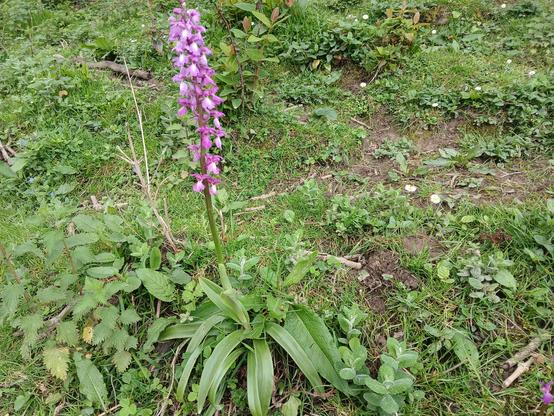
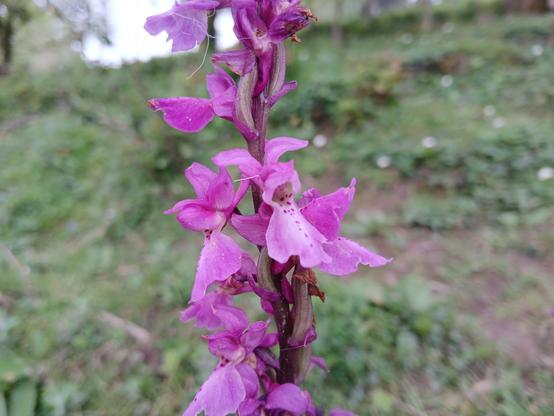
Orkidea arruntena bada ere, nolako polita den! Orchidacea familikoa
Orchis mascula #landarea #Botanika
Mercator Misconceptions - Clever Map Shows the True Size of Countries [Especially In High Latitudes]
--
https://www.visualcapitalist.com/mercator-map-true-size-of-countries/ <-- shared technical article
--
https://equal-earth.com/ <-- shared Equal Earth map projection details [the poster’s recommended global projection for many use cases]
--
[note the ‘true’ size of high latitude landmasses like Greenland and Canada (and Russia as well); note also that the Mercator Projection was not / is not a ‘tool of colonialism’, geopolitics or the like, it was/is ‘simply’ a very clever projection to aid in marine navigation]
#GIS #spatial #mapping #projection #Greenland #Canada #Russia #size #landarea #projection #mapprojection #JustSayNoToGallPeters #equalarea #Mercator #marine #nautical #navigation #spheroid #globe #area #shape #direction #equalearth #Africa #rhomb #rhomblines
Mercator Misconceptions: Clever Map Shows the True Size of Countries

The world map you know is totally wrong. Check out this clever graphic, which helps put into perspective the true size of countries.

Visual Capitalist

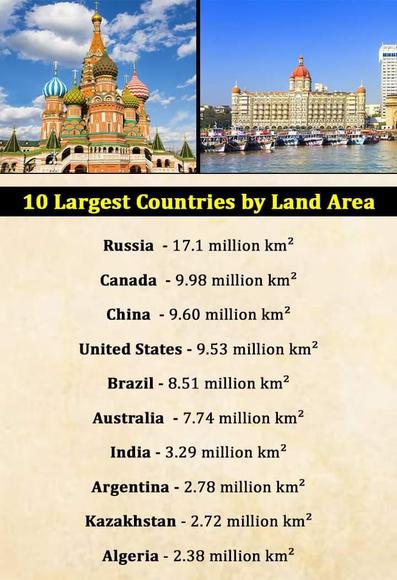
Medzi najväčšie krajiny podľa pevniny patrí Rusko s rozlohou 17,1 milióna kilometrov štvorcových a Kanada s rozlohou 9,98 milióna kilometrov. Tieto rozsiahle národy majú rozmanité krajiny, od ruskej sibírskej divočiny po kanadskú arktickú tundru, čo z nich robí hlavných geografických gigantov.

#Russia #Canada #LargestCountries #Geography #GlobalGiants #VastLandscapes #WorldGeography #LandArea #Siberia #ArcticRegions

Scientists looked at images from space to see how fast Antarctica is turning green. Here’s what they found

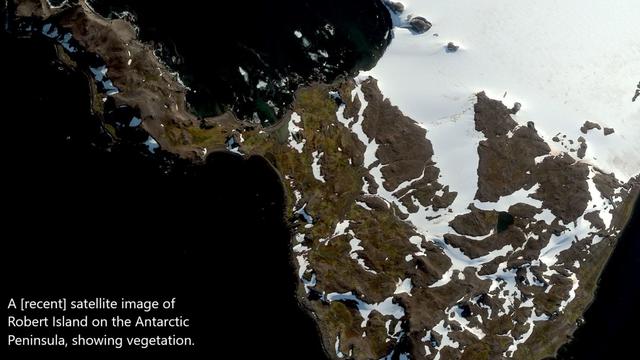
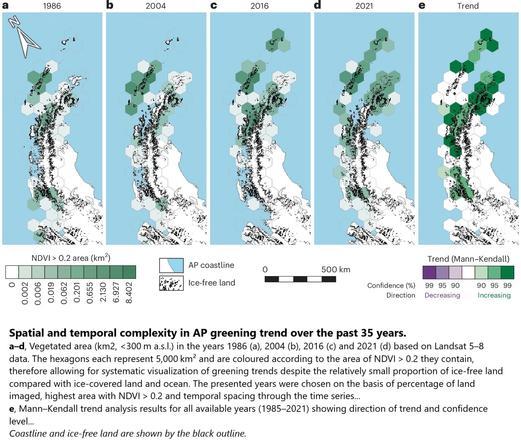
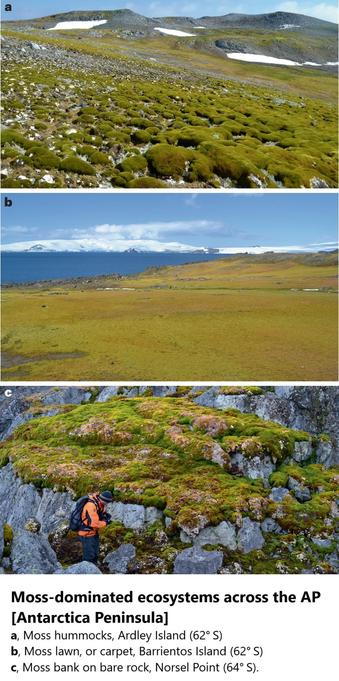
Parts of icy Antarctica are turning green with plant life as the region is gripped by extreme heat events, new research shows, sparking concerns about the changing landscape on this vast continent.

CNN
I've been re-working a visualization based on lines in #BrettWalker's #ToxicArchipelago. His 1994 data suggested that Japan poured 33x per unit area the over the amount poured by the USA. Down to 17x with recent data!! The code is clunky as as I reacquaint with #RacketPlot and see what I want to do at the same time. After comparing #CementProduction with #LandArea, let's see a Population comparison too. And compare Japan with Germany, and look into Incinerators..
https://gitlab.com/bzmall2/gdm-dry/-/tree/main/data-visualization/concrete-Japan-USA
data-visualization/concrete-Japan-USA · main · Brian Small / gdm-dry · GitLab

Develop scripts for gdm teachers to use in DrRacket. The teacher will put directory names in the scripts. The scripts will put out a page for printing on...

GitLab