Paul Watson, founder of Greenpeace &Sea Shepherd he is being persecuted for his actions agnst whaling ships
Watson arrived in Brazil a few days ago to participate in the COP30, which is why the Japanese govt requested his arrest &extradition to Japan, alleging the activist is responsible for alleged attacks on vessels conducting scientific research.

~...scientific research....~

#Ecocide #Whales #EnvironmentalCollapse

https://www.brasildefato.com.br/2025/11/04/japao-pressiona-brasil-para-prender-e-extraditar-ambientalista-canadense-entenda/

Japão pressiona Brasil para prender e extraditar ambientalista canadense; entenda

A Embaixada do Japão no Brasil enviou ao Palácio do Planalto, através do Itamaraty, uma carta pedindo a extradição do

Nick Shoulders – Apocalypse Never | WGOM

  wouldn't be my week without being late to the party.

From "Recalibration of limits to growth: An update of the #World3 model"

by Arjuna Nebel, Alexander Kling, Ruben Willamowski, Tim Schell

First published: 13 November 2023

4.3 Future trends

"So far, the results have mainly been considered in comparison with the empirical data for the recalibration. However, the course of the variables is also interesting in terms of future trends. Here, the model results clearly indicate the imminent end of the exponential growth curve. The excessive consumption of resources by industry and industrial agriculture to feed a growing world population is depleting reserves to the point where the system is no longer sustainable. Pollution lags behind industrial growth and does not peak until the end of the century. Peaks are followed by sharp declines in several characteristics.

"This interconnected collapse, or, as it has been called by Heinberg and Miller (2023), #polycrisis, occurring between 2024 and 2030 is caused by resource depletion, not pollution. The increase in environmental pollution occurs later and with a lower peak (Figure 3).

"However, it is important to note that the connections in the model and the recalibration are only valid for the rising edge, as many of the variables and equations represented in the model are not physical but socio-economic. It is to be expected that the complex socio-economic relationships will be rearranged and reconnected in the event of a collapse. World3 holds the relationships between variables constant. Therefore it is not useful to draw further conclusions from the trajectory after the tipping points. Rather, it is important to recognize that there are large uncertainties about the trajectory from then on, building models for this could be a whole new field of research.

"The fact is that the recalibrated model again shows the possibility of a collapse of our current system. At the same time, the BAU scenario of the 1972 model is shown to be alarmingly consistent with the most recently collected empirical data.

"#Herrington (2021) also concluded in her data comparison that the world is far from a stabilized world scenario where the #overshoot and #collapse mode is brought to a halt. As a society, we have to admit that despite 50 years of knowledge about the dynamics of the collapse of our life support systems, we have failed to initiate a systematic change to prevent this collapse. It is becoming increasingly clear that, despite #technological advances, the change needed to put us on a different trajectory will also require a change in #BeliefSystems, #mindsets, and the way we organize our society (Irwin, 2015; Wamsler & Brink, 2018). [SW model]

"At the point of collapse, the resolution of the model also reaches the limit of further plausible statements. The regional differences in demographic and economic terms are too great to be reduced to simple, highly aggregated variables. To address this problem, a new system dynamics model has been developed on the occasion of #LtG's 50th anniversary which is called Earth for all (Sandrine Dixson-Decleve et al., 2022). It introduces a regional resolution and a measure of social inequality and tension. There is also a greater focus on the causes and effects of the #ClimateCrisis. In #Earth4all, the authors no longer focus on scenarios with sharp declines in the main variables. Instead, the scenario Too little too late describes that the effects of the climate crisis will continue to increase and social tensions will rise, causing the well-being index to decline over time. In another scenario, #GiantLeap, it is shown that these negative developments could also be stopped. The authors then propose various policy changes to achieve this (Sandrine Dixson-Decleve et al., 2022). "

https://onlinelibrary.wiley.com/doi/full/10.1111/jiec.13442

#Capitalism #CorporateColonialism
#Warning #Extinction #ClimateCrisis #EnvironmentalCollapse
#Resources #Ecocide #Technology #SocietalChange #Collapse #SolarPunk #SocietalChange #Degrowth #MindsetChange

A more pessimistic outlook, based on 2023 recalibrations... (From #Resiliency.org)

#LimitsToGrowth was right about collapse

By Andrew Curry, May 20, 2025

Excerpt: "Downhill from here

"The last chart assembles something from the data that wasn’t done in the original Limits to Growth work because the concept hadn’t been developed. But it is possible to assemble a #HumanDevelopmentIndex from the data, and reference it against the original model and the revised version. It doesn’t come out well.

(Source: Nebel et al, 2023, adapted Klement)

"On this last chart, Klement is most depressed, and I think with good reason:

" 'If [this chart] is true, it says that today is peak human civilisation, from now on we are going backward on a global level in terms of human development and quality of life, While some countries will continue to improve, other countries and the planet as a whole will start to go backward, ultimately dropping back to similar levels of human development and quality of life as in 1900 by the end of this century.'

"Tipping point

"The overall conclusion by the article’s authors is:

" '[T]he model results clearly indicate the imminent end of the exponential growth curve. The excessive consumption of resources by industry and #IndustrialAgriculture to feed a growing world population is depleting reserves to the point where the system is no longer #sustainable. #Pollution lags behind industrial growth and does not peak until the end of the century. Peaks are followed by sharp declines in several characteristics.

"They also note that the cause of this turning point is resources, not ‘pollution’:

" 'This interconnected collapse… occurring between 2024 and 2030 is caused by resource depletion, not pollution.

"They also have an interesting caveat. This is that the way the #World3 model works is a through a set of connections that exist within an environment of growth. In an environment of decline, they are likely to reconfigure themselves in different ways. That doesn’t mean that there won’t be a decline—just that the current lines in the model that describe it may not follow quite the same patterns.

"But one final note from me. Economists get over-excited when anyone mentions ‘#degrowth’, and fellow-travellers such as the Tony Blair Institute treat climate policy as if it is some kind of typical 1990s political discussion. The point is that we’re going to get degrowth whether we think it’s a good idea or not. The data here is, in effect, about the tipping point at the end of a 200-to-250-year exponential curve, at least in the richer parts of the world. The only question is whether we manage degrowth or just let it happen to us. This isn’t a neutral question. I know which one of these is worse."

Read more:
https://www.resilience.org/stories/2025-05-20/limits-to-growth-was-right-about-collapse/

#Capitalism #CorporateColonialism
#Warning #Extinction #ClimateCrisis #EnvironmentalCollapse
#Resources #Ecocide #Technology #SocietalChange #Collapse

Journalist and technology writer Kaif Shaikh disagrees with #GayaHerrington, in this 2025 response. Kaif refers to #JoachimKlement, an economist, who believes that we are already on the way to a collapse, with society returning to the way it was in the 1900s (more about that in another post).

"So, where are we now, and what is the responsible takeaway?

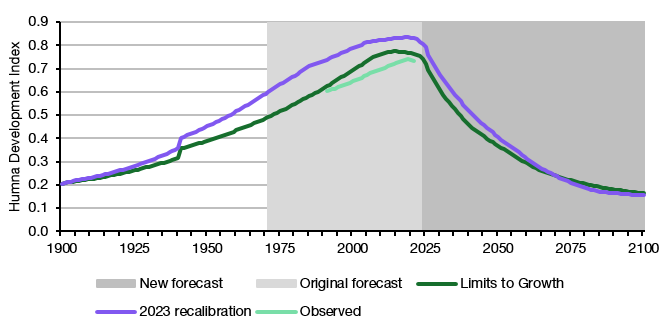
"The 1972 framework still describes the structure of our situation. Herrington’s 2021 comparison shows that the world’s recent history has tracked World3’s growth-first pathways closely enough to warrant concern about declines later this century, potentially beginning to bite this decade. Her 2022 reflection adds two critical refinements. The divergence among futures happens after 2020, and the most livable path requires a conscious redesign of priorities toward efficiency, pollution control, and social investment rather than throughput.

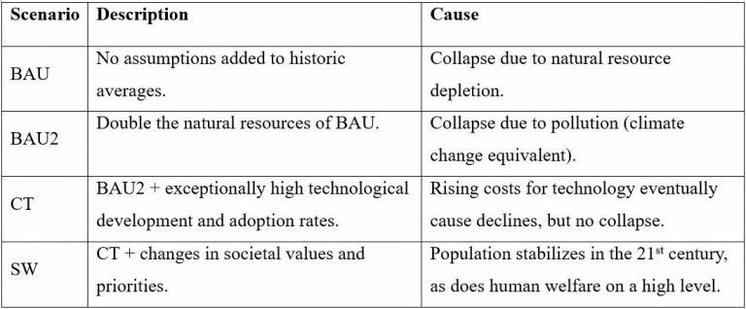
"The Nebel et al. recalibration, as interpreted by Klement, indicates that even after re-estimating parameters with better data, the system still exhibits overshoot and collapse, with the trigger rooted in resource depletion. The implication is that 'more of the same, but faster' is not a strategy. It is precisely what turns today’s creativity into tomorrow’s fragility.

"If there is one message to carry forward, it is Herrington’s: the window for a deliberate trajectory change is narrow but real. The 'Stabilized World' is not a utopian fantasy layered onto a model. It emerges from the same feedback structure that produces overshoot under different goals. Change the goal, and the loops that currently amplify stress can be redirected to reinforce #resilience.

"That change looks less like a silver bullet and more like a portfolio of priorities that the model especially favors. Using fewer resources per unit of well-being, investing in pollution abatement so damages do not accumulate, and building health and education services that improve human welfare without relying on ever-rising material throughput.

"It is also important to be precise about uncertainty. The studies do not claim to know exactly when or how any particular nation will experience stress. #World3 is a global model of dynamics, not a country-by-country forecast. Nor do the authors claim that technology is useless.

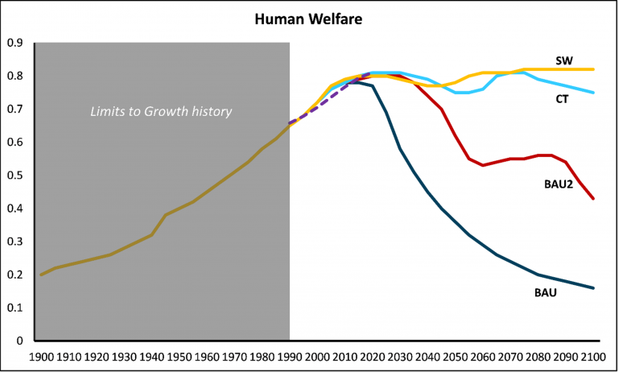
"Quite the opposite. Technology can raise ceilings and delay peaks. But as co-author #DennisMeadows has often emphasized in discussions about #LimitsToGrowth over the years, higher peaks without structural change can mean sharper falls (#Overshoots).

"Herrington’s point is that 'technology plus the same goal' keeps us on the wrong curve. Technology deployed in the service of different goals, efficiency, abatement, and human development, separated from material throughput, can move us onto the SW trajectory.

"Finally, the recalibration’s note about system behavior under contraction deserves attention. If the world does tip into decline, feedbacks may rearrange themselves in ways the original model cannot fully capture. That is not a reason to dismiss the warning. It is a reason to move earlier, while our degrees of freedom are greater, and adaptation can be shaped rather than suffered. The studies summarized here do not argue that collapse is inevitable. They suggest that collapse is a real risk if we keep our current goals, and that avoiding it means choosing new ones."

Read more:
https://interestingengineering.com/culture/mit-1972-global-collapse-warning-revisited

Archived version:
https://archive.ph/mUIa2

#SharingEconomy #SolarPunk #Sustainability #Capitalism #CorporateColonialism #Warning #Extinction #ClimateCrisis #EnvironmentalCollapse #Ecocide #Technology #SocietalChange

MIT’s 1972 collapse model updated: Humanity enters make-or-break decade

A 1972 model warned of collapse if growth continued unchecked. Decades later, the data shows it was disturbingly accurate.

Interesting Engineering

Back to Gaya Herrington's chart -- including an explanation of what the terms mean...

BAU = #BusinessAsUsual
BAU2 = Double The Resources that we estimate are available -- Business As Usual carries on for a while longer.
CT = Comprehensive Technology [assumes BAU2].
SW = Stabilized World. [CT + BAU2].

Herrington:

"The BAU scenario was based solely on historic averages without any assumptions. As mentioned, this 'business as usual' scenario ends in collapse.

[...]

"BAU2 assumes double the resources as in BAU. More abundant resources do not avoid a collapse; its cause merely changes from a resource scarcity crisis to a pollution one. With the resource constraint relaxed, incentives to innovate and/or change societal priorities are reduced, so business as usual goes on for longer. This creates so much pollution that agricultural output and human health plummet after some breakpoint. BAU2 essentially tells the story of #ecosystem breakdown from accumulated# pollution, including from greenhouse gasses (i.e., #ClimateChange)."

Both SW and CT involve the use of #Technology (#SolarPunk?), though SW is focused on sustainability.

Herrington: "We’re probably not on a path to a stable world [SW]. An update of this comparison in another few years might be able to identify one specific closest fit to empirical data. Without major changes in societal priorities, this is unlikely to be the scenario showing a sustainable path; the SW scenario, in which a decline in human welfare within this century is minimized, aligned with the data the least.

[...]

"CT represents the technologist’s belief in humanity’s ability to innovate out of environmental constraints. It assumes unprecedented technological innovation in a world that otherwise does not change its priorities much. The new technologies do in fact help avoid an outright collapse. However, CT still depicts some declines because the technology costs become so high that not enough resources are left for agricultural production and health and education services."

https://www.clubofrome.org/blog-post/herrington-world-model/?fbclid=IwAR34J-QE4mDCelAawQtHAP24B7IPDLFB_lmT_qLu-5_SKgy9fpWI15-FcY0

#SharingEconomy #SolarPunk #Sustainability #Capitalism #CorporateColonialism #Warning #Extinction #ClimateCrisis
#EnvironmentalCollapse #Ecocide #Technology #SocietalChange

Gaya Herrington's chart showing #HumanWelfare and the #LimitsToGrowth, beginning from 1900 to the future (2100).

The graph has 4 lines - SW (yellow), CT (blue), BAU2 (red), and BAU (dark blue). The yellow line dips down slightly, then is pretty even. All the other lines point downward, with BAU being the furthest down (indicating a very bad quality of life for humans).

"Here, I’ll just share my conclusions, illustrated by a graph of the variable people might be most concerned with: living standards (Figure 1). This graph is from my upcoming book Five Insights for Avoiding Global Collapse, soon available online under Creative Commons, which contains further research analysis and 2022 data update of my comparison.

"I found an overall close alignment of empirical data with the scenarios, for now, because they only diverge significantly after 2020. This accuracy decades into the future gives reason to take the #World3 dynamics seriously. If we do that, we unfortunately must conclude that the future holds risks of declines in welfare, among other things, and some of these declines are indeed steep enough to constitute a collapse. The scenario indicated with 'SW' shows no collapse and the highest living standards. However, empirical data aligned least closely to SW.

"I interpret all this as humanity having a now or never opportunity to change direction. Contrary to what my friend texted me, I did not predict the end of the world, just like #LtG didn’t at the time; I noticed #WarningSignals and voiced a call to action. Empirical data are not far from SW yet, and humankind can determine where future data points fall. How? Well, there is one key difference between SW and the other scenarios: in SW, humanity consciously lets go of growth as its goal. Under SW assumptions, society shifts priorities away from industrial output growth towards resource efficiency, #pollution abatement, and #health and #education services. We can do that in the real world too.

"Will we? Before you answer that question in your head, let’s frame it properly. Because this is not about whether we want to avoid collapse; it’s whether we want better. SW represents a redesign of society away from material consumption, around human and #ecological well-being. Yes, that would take a lot of effort. But we’d also be working on healing society, towards a future of thriving. Does that sound to you like something worth putting in work for?"

In other words, and end to #Capitalism and implementation of #Degrowth, with the goal being healthy, educated humans living on a planet that they are actively trying to clean-up!

Source:
https://www.clubofrome.org/blog-post/herrington-ltg50/

#SharingEconomy #SolarPunk #Warning #Extinction #ClimateCrisis
#EnvironmentalCollapse #Ecocide

Blog post from 2022: What a 50-year-old world model tells us about a way forward today

by Gaya Herrington, 17 May 2022

"My research went viral last summer. I found out via a friend’s text, jokingly accusing me of 'announcing the end of the world.' For several days, headlines on major US news pages declared that my research proved we are on the brink of collapse. A few days later, UK pages touted the same headlines. Then I saw my name popping up in languages I do not know, from Swedish, to Greek, to Chinese, to Sinhala.

"It took me a bit by surprise. My research had been published months earlier, in November 2020. Also, it was a data comparison of a model from a book that was almost half a century old. Apart from the headlines being a simplistic version of my research’ message, they also gave the impression that the possibility of societal collapse suddenly had been revealed. But this warning was a key message of The #LimitsToGrowth (#LtG) book, which the authors Meadows, Meadows, Randers & Behrens, published back in 1972. In LtG, commissioned by the #ClubOfRome, the authors identified society’s relentless pursuit of growth not as the solution to, but the cause of, so many of the #environmental and social crises that plague humanity still today. Their analysis was based on a global model called World3. The authors created different scenarios by varying World3’s underlying assumptions. This scenario analysis helped them study global dynamics between variables including industrial output, resources, pollution, and living standards. In my research, I compared four LtG scenarios against a few decades of empirical data. Details about the scenarios methods and results, can be found in my article in Yale’s Journal of Industrial Ecology. An easier read with the gist of my findings was also published on the Club of Rome website. Here, I’ll just share my conclusions, illustrated by a graph of the variable people might be most concerned with: living standards (Figure 1). This graph is from my upcoming book Five Insights for Avoiding Global Collapse, soon available online under Creative Commons, which contains further research analysis and 2022 data update of my comparison."

The author goes on to explain the graph. I'm focusing on Herrington's scenarios, especially the "SW" scenario in my next post...

https://www.clubofrome.org/blog-post/herrington-ltg50/

#Degrowth #Extinction #ClimateCrisis #EnvironmentalCollapse #Ecocide #Warning

What a 50-year-old world model tells us about a way forward today - Club of Rome

17 May 2022 -

Club of Rome
Hope and Defeatism

(Antonio Turiel) We must abandon, once and for all, the absurd insistence on hope —the opiate of our collective conscience. That's not what we need. The response we must give is not "hope" but activism.

15/15\15

‘Alarming’ bug splat decline on UK cars raises fears for flying insect numbers https://www.theguardian.com/environment/2025/apr/30/alarming-bug-splat-decline-uk-cars-fears-flying-insect-numbers

Annual survey of numberplates from more than 25,000 journeys reveals 63% fall in squashed bugs since 2021

#wereallgoingtodie #ecology #biodiversity #insects #environmentalCollapse

‘Alarming’ bug splat decline on UK cars raises fears for flying insect numbers

Annual survey of numberplates from more than 25,000 journeys reveals 63% fall in squashed bugs since 2021

The Guardian