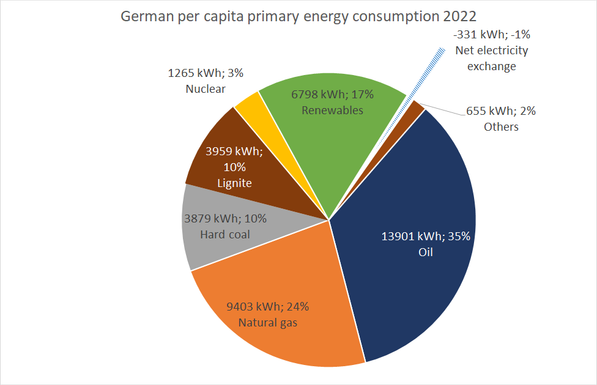
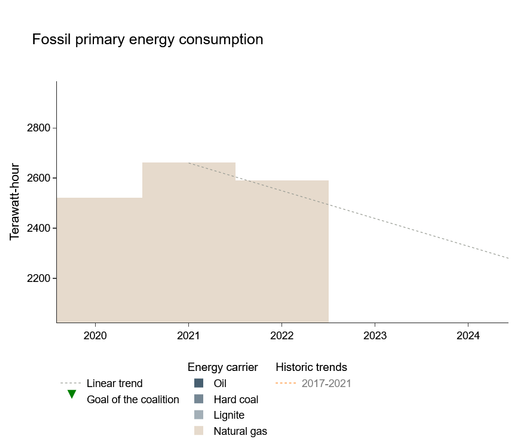
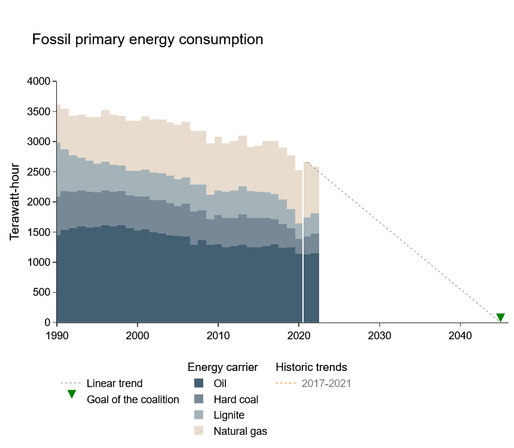
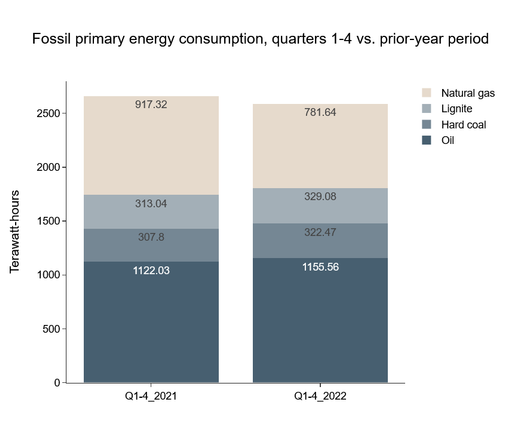
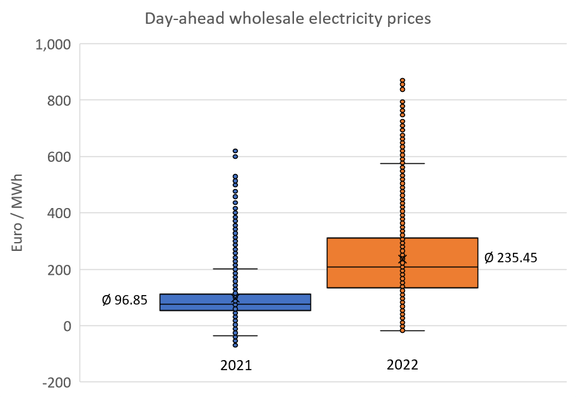
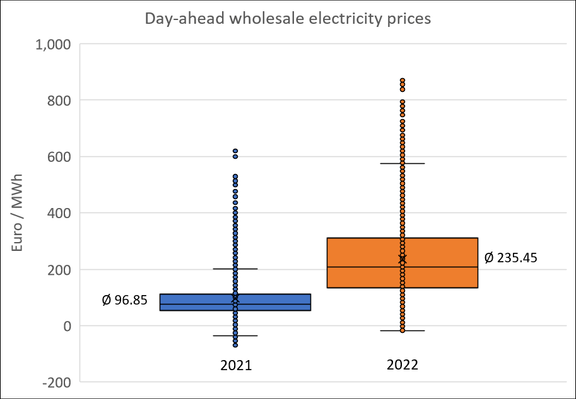
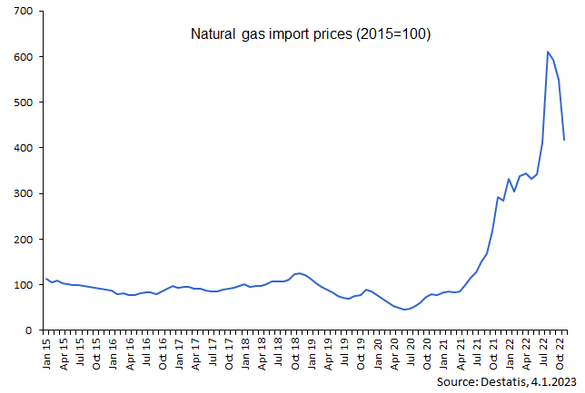
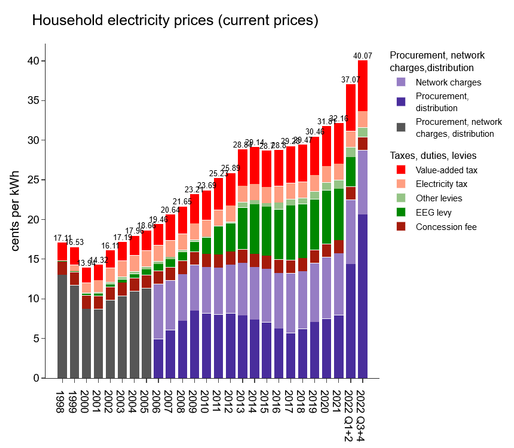
New Year's Resolution: I commit to share one German energy fact here per day throughout 2023. I'll try to cover demand and supply, renewables and other technologies, some energy policy issues, and other things that I encounter in my work and which I find interesting. Let's see if I can do this for 365 days without me (or you) getting bored! 🔋 ⚡ ☀️ 🔌
#GermanEnergyFacts #newyearsresolution #energymastodon

Okay, everyone sober again? Then let's start the new year with #GermanEnergyFact #1: Primary #energy consumption.

According to new #AGEB data, German primary energy consumption was 11,829 PJ in 2022. If you are more comfortable with watt-hours: this corresponds to 3286 TWh - or nearly 40,000 kWh per capita.

▶️ More than a third of this is #oil - on average a German consumed nearly 14,000 kWh of oil.
▶️ Around a quarter is natural #gas, more than 9000 kWh per capita.

#GermanEnergyFact #1 ctd.
▶️ #Lignite & hard #coal: each ~10%, or nearly 4000 kWh. 🇩🇪 is still a coal country.
▶️ #Renewables now account for 17% of primary energy consumption, a bit below 7000 kWh per capita.
▶️ #Nuclear energy is down to 3%, a bit above 1000 kWh.
▶️ Note that there were net electricity #exports of a good 300 kWh per person. The size of this is not really relevant, but the sign is interesting: 🇩🇪 still is a *net exporter* of electricity. (Sorry for a negative share in the pie chart)

#GermanEnergyFact #1 ctd.

If you think that the renewable share is still fairly small, and the #Energiewende needs to speed up, you are right! But also consider that a shift toward wind & solar and electrification of heating and mobility "automatically" decrease primary energy consumption, as it is much less wasteful compared to, e.g., electricity generation in thermal power plants and internal combustion engines. So expect overall PEC to decrease and the RES share to increase fairly quickly.

#GermanEnergyFact #1 ctd.

To put the German ~40,000 kWh per capita consumption into comparison: According to @ourworldindata (only 2021 data available so far), the 🇩🇪 per capita PEC is about twice the 🌎 average, around a third more than 🇨🇳's, and a bit above the 🇪🇺 average.

But it is only about two thirds of the 🇦🇺 per capita PEC, and a bit more than half of the 🇺🇸 .

Sources:
AGEB: https://ag-energiebilanzen.de/energieverbrauch-faellt-2022-auf-niedrigsten-stand-seit-der-wiedervereinigung/
Or World in Data: https://ourworldindata.org/grapher/per-capita-energy-stacked?country=Africa~Asia~AUS~CHN~European+Union+%2827%29~DEU~OWID_WRL~USA~GBR~South+America~ZAF~SAU~QAT

Next #GermanEnergyFact will be shorter, promise!

Energieverbrauch fällt 2022 auf niedrigsten Stand seit der Wiedervereinigung » AG Energiebilanzen e. V.

Zuwächse bei Erneuerbaren und Kohle / CO₂-Emissionen sinken 2022 nur leicht Berlin (20.12.2022) – Der Energieverbrauch in Deutschland erreichte 2022 eine Höhe von 11.829 Petajoule (PJ) beziehungsweise 403,6 Millionen Tonnen Steinkohleneinheiten (Mio. t SKE). Das entspricht einem Rückgang um 4,7 Prozent gegenüber dem Vorjahr. Der Energieverbrauch erreichte damit nach den Berechnungen der Arbeitsgemeinschaft Energiebilanzen (AG Energiebilanzen) […]

AG Energiebilanzen e. V.

#GermanEnergyFact #2: Let's have a closer look at the development of the fossil part of primary energy consumption in 🇩🇪. We regularly track this in the #openenergytracker, where I also take the following graphs from. Zoom- & clickable graphs and underlying data here: https://openenergytracker.org/en/docs/germany/energyconsumption/#fossil-energy-primary-consumption

▶️ Between 1990-2022, fossil #primaryenergyconsumption decreased by 28%.
▶️ 2020 saw the lowest consumption so far, driven by the pandemic.
▶️ In 2021, consumption increased again because of economic recovery.

Energy consumption - Open Energy Tracker

The Open Energy Tracker is a platform to track governmental goals of energy policies.

#GermanEnergyFact #2 ctd.
▶️ In 2022, fossil primary energy consumption slightly decreased again, driven by soaring #energyprices.
▶️ The 🇩🇪 government aims to achieve #climateneutrality by 2045. As there is no explicit target or path for phasing out fossil primary energy consumption, we assume an indicative linear reduction path between 2021, the starting year of the current German 🚦 coalition, and 2045
▶️ The 2022 fossil primary energy consumption is above that path (zoomed in graph).
#GermanEnergyFact #2 ctd.
▶️ The share of natural #gas in 🇩🇪 fossil primary energy consumption increased from 18% in 1990 to 35% in 2020; in line with a narrative of natural gas a "bridge fuel" for the #energytransition.
▶️ This trend reversed in 2022, driven by Russia's attack on #Ukraine and its consequences for German gas supply: gas consumption decreased by 15% (!) between 2021 and 2022.
▶️ Conversely, the consumption of both hard #coal and #lignite increased by 5% each, and oil by 3% 2021-2022.

#GermanEnergyFact #3: #LNG

I planned to post more facts about German energy consumption in this first week of the new year, but for a current occasion, here is a small digression: Today, the first ever (regular) #LNG tanker #MariaEnergy arrived in Germany.

Not so fun fact: it is natural #gas produced from #fracking.

Story: https://www.dw.com/en/first-lng-tanker-arrives-at-germanys-new-floating-terminal/a-64272015

While this first ever #LNG shipment received a lot of media attention, and it certainly is a significant event, let's put it in perspective:

First LNG tanker arrives at Germany's new floating terminal

Germany has received its first standard shipment of LNG to one of its newly built terminals on the North Sea. Activists have protested the arrival of gas acquired through fracking.

Deutsche Welle

#GermanEnergyFact #3 ctd.

Since September 2022, the residential and commercial sectors in 🇩🇪 already saved natural #gas equivalent to 21.5 (!) average #LNG tankers purely because of changes in behavior. This is what my colleagues @aroth and Felix Schmidt found in an analysis that we constantly update on the #DIW #Ampelmonitor #Energiewende: https://www.diw.de/en/diw_01.c.841560.en/ampel-monitor_energiewende__monitor_of_the_german__traffic_light__coalition___s_energy_transition_targets.html#ab_862329

More graphs and info on the methods used are available in the #openenergytracker: https://openenergytracker.org/en/docs/germany/naturalgas/

DIW Berlin: Ampel-Monitor Energiewende (Monitor of the German

BLOG Overview Note on the graphs Explanations on share of renewable energy in the electricity sector Why "traffic light"? Energy targets of the German government - and what has been achieved The traffic light coalition is history - but it has left its mark on energy policy. The traffic light coalition set out to bring new momentum to the energy transition and has set itself a number of specific ...

DIW Berlin

#GermanEnergyFact #4: Electric vehicles 🔌 🚗

Again, I wanted to continue with energy consumption facts... but because of current events, I HAVE to talk about electric cars! Today new must-see #KBA data came out. All data and zoomable graphs also available in the #openenergytracker: https://openenergytracker.org/en/docs/germany/emobility/

▶️ December 2022: Highest-ever share of battery-electric vehicles (#BEV) in new #car registrations in 🇩🇪 , 33.2%!
▶️ Also, a record share for plug-in hybrids (#PHEV) in December with 22.2%.

Electric mobility - Open Energy Tracker

The Open Energy Tracker is a platform to track governmental goals of energy policies.

#GermanEnergyFact #4 ctd.

▶️ That is, more than 55% of all new cars in December 2022 had a plug 🔌 . In the very motherland of the internal combustion engine 💪
▶️ This record month was probably driven by reduced purchase subsidies from January 2023 on: no more subsidies for plug-in hybrids, and max. subsidy for BEV now €4500 (was 6000€).
▶️ Also important: with this record month, the fleet of pure battery-electric cars in 🇩🇪 now surpassed 1 million 🎉
▶️ Still way to go to reach 15 mio by 2030...

#GermanEnergyFact #4 ctd.

Für alle, die es lieber auf Deutsch lesen: zoombare Abbildungen zum Dezember-Rekord bei der #Elektromobilität sowie zur erreichten ersten Million bei der Bestandsflotte batterieelektrischer #Pkw gibt es jetzt auch als kleinen Blog #5 im #DIW #Ampelmonitor #Energiewende: https://www.diw.de/de/diw_01.c.862674.de/nachrichten/ampel-monitor_energiewende__5__eine_million_elektrofahrzeuge__zulassungsrekord_im_dezember.html
#Elektroauto #KBA

DIW Berlin: Ampel-Monitor Energiewende #5: Eine Million Elektrofahrzeuge, Zulassungsrekord im Dezember

Von Wolf-Peter Schill Die Abbildung zeigt die Anteile von rein batterieelektrischen Pkw (sowie ergänzend auch von Plug-in-Hybriden) an den monatlichen Neuzulassungen laut Kraftfahrt-Bundesamt. Im Dezember 2022 hatten batterieelektrische Pkw einen Anteil von 33,2 Prozent an den Pkw-Neuzulassungen in Deutschland, das ist bisheriger Rekord. Hinzu kamen 22,2 Prozent Plug-in Hybride. Somit hatten im Dezember ...

DIW Berlin

#GermanEnergyFact #5: It gets dirty - lets talk about coal.

After two unplanned digressions (LNG and electric cars), I now return to primary #energy consumption facts for 🇩🇪 , this time focusing on hard #coal. I use new #AGEB data available here: https://ag-energiebilanzen.de/wp-content/uploads/2022/11/03-Steinkohle_2022.pdf

▶️ Overall coal consumption increased by nearly 5% in 2022 vs. 2021. #wrongdirection
▶️ Overall consumption in 2022 was 323 TWh, or nearly 4000 kWh per capita. #thisisstillalot

#GermanEnergyFact #5 ctd.

▶️ The increase in hard #coal consumption in 2022 was particularly high for coal used in power plants (+16%), driven by a surge in #electricity prices and increased electricity exports.
▶️ In contrast, coal used for steel making decreased (-6%). This goes hand in hand with a decrease in steel production of roughly the same size (compare German steel industry press release https://www.stahl-online.de/medieninformationen/rohstahlproduktion-in-deutschland-november-2022/)

Rohstahlproduktion in Deutschland: November 2022 | stahl-online.de

Die Rohstahlerzeugung in Deutschland ist im November 2022 im Vergleich zum Vorjahr um 18 Prozent auf rund 2,8 Millionen Tonnen eingebrochen. Das ist der niedrigste Wert seit Juli 2020. Im aufgelaufenen Zeitraum von Januar bis November beträgt der Rückgang der Rohstahlproduktion nunmehr rund 8 Prozent. Aller Voraussicht nach wird die Erzeugung im Jahr 2022, wie […]

stahl-online.de |

#GermanEnergyFact #6 is even more dirty than the last one: #lignite

Here is most recent #AGEB data on lignite for 2022: https://ag-energiebilanzen.de/wp-content/uploads/2022/12/BK-KJ22-erste-Schatzung-09.12.2022.pdf

▶️ Primary #energy consumption of lignite in 🇩🇪 increased by 5% in 2022 vs. 2021. #wrongtrend
▶️ The overall consumption in 2022 was 329 TWh. That is nearly 4000 kWh per capita #thatsalot!
▶️ Around 90% of this was used for #electricity generation, which was also up by around 5% vs. 2021, driven by exploding electricity prices

#GermanEnergyFact #6 ctd.

▶️ Using these numbers, you can calculate an average efficiency of #electricity generation from #lignite of slightly below 40% in 2022.
▶️ That is, around 178 TWh of primary energy from lignite went through the chimneys and cooling towers of power plants unused - around 2100 kWh per capita 🤯

#endcoal #leaveitintheground Photo: @mariusmichusch

#GermanEnergyFact #7: natural #gas

Yesterday, the Bundesnetzagentur released new data on 🇩🇪 natural gas consumption in 2022: https://www.bundesnetzagentur.de/DE/Gasversorgung/aktuelle_gasversorgung/Rueckblick/start.html

▶️ Overall gas consumption in 2022 was 847 TWh, 17.6% less than 2021
▶️ Households and commerce reduced consumption by 19.1% (wow!), industry by 16.6% compared to 2021
▶️ Savings were driven by much-increased gas prices, warmer weather, and changes in heating behavior
▶️ Some data discrepancies between BNetzA and AGEB data, but savings trend is similar

Bundesnetzagentur - Rückblick: Gasversorgung im Jahr 2022

Rückblick: Gasversorgung im Jahr 2022

#GermanEnergyFact #7 ctd.

Zooming in on #gas savings made by households and commercial consumers: in the #openenergytracker, we regularly differentiate savings components related to temperature and to changes in behavior: https://openenergytracker.org/en/docs/germany/naturalgas/

We find that households and commerce have consistently saved gas by changing their behavior since September 2022. Except for the Christmas week it seems - maybe people wanted to have it as cosy as usual during these days? 🎄 Great work by @aroth 👏

Current natural gas consumption - Open Energy Tracker

The Open Energy Tracker is a platform to track governmental goals of energy policies.

#GermanEnergyFact #8: oil

I'm wrapping up this first week with some #oil consumption data for 🇩🇪 (sorry I'm a bit late, this was a family day), based on recent #AGEB data: https://ag-energiebilanzen.de/wp-content/uploads/2022/12/01-Mineraloel_2022.pdf

▶️ Sales of #diesel fuel decreased by 1% from 2021 to 2022, #gasoline +4%, jet fuel +44% (!)
▶️ Mio t are hard to deal with, so here are derived liter/capita numbers: ~490 l diesel, ~270 l gasoline, ~130 l jet fuel per person. Note: these averages includes all people, also those who never drive or fly.

#GermanEnergyFact #8 ctd.

So I'm clearly not an expert when it comes to supply and demand of oil products; but I found it quite interesting that the sales of diesel fuel hardly decreased despite much higher prices, and gasoline sales even slightly increased.

The post-pandemic surge in jet fuel use is also striking (and worrying).

Thanks for following me through this first week, which largely focused on indicators of #energy consumption. Next week may see a focus on energy #prices, stay tuned!

#GermanEnergyFact #9: wholesale electricity prices ⚡ 💶

Data provided by the Bundesnetzagentur / SMARD platform shows that 2022 was a record-breaking year in terms of #electricity #prices: https://www.smard.de/home/downloadcenter/download-marktdaten/?downloadAttributes=%7B%22selectedCategory%22:3,%22selectedSubCategory%22:8,%22selectedRegion%22:%22DE-LU%22,%22selectedFileType%22:%22XLSX%22,%22from%22:1609455600000,%22to%22:1672527599999%7D

▶️ The average day-ahead wholesale price in 🇩🇪 more than doubled from around 97 €/MWh in 2021 to 235 €/MWh in 2022
▶️ The highest hourly price increased from 620 to 871 €/MWh
▶️ The price spread also increased a lot: the interquartile range increased from 59 to 176 €/MWh

#energymastodon

SMARD | Marktdaten

#GermanEnergyFact #9 ctd.

▶️ The wholesale price increase was driven by a surge in natural #gas prices.
▶️ Further, low generation from hydro power and French nuclear contributed to high prices.
▶️ Generators with low marginal costs have benefited a lot from this - which lead to a EU-wide temporary revenue cap for generators.
▶️ Any technology that could offer temporal #flexibility must have made tons of money in 2022. Probably a golden year for electricity #storage and other flex technologies!

#GermanEnergyFact #10: natural gas import prices

A main reason for the surge in wholesale electricity prices (see #GermanEnergyFact #9) is a record increase in natural #gas #import #prices, as gas-fired plants often set hourly electricity prices. Data provided by the Federal Statistical Office of 🇩🇪 : https://www.destatis.de/DE/Themen/Wirtschaft/Preise/Publikationen/Energiepreise/energiepreisentwicklung-xlsx-5619001.xlsx

▶️ Gas import prices in 2022 on average increased by factor 3 compared to 2021, and nearly by factor 7 (!) vs. 2020 (only counting Jan-Nov)
▶️ The peak month was August 2022

Daten zur Energiepreisentwicklung - Lange Reihen bis November 2022

Diese monatlich herausgegebene Veröffentlichung fasst Daten zur Entwicklung der Energiepreise aus unterschiedlichen Statistiken der Gruppe Preise sowie von Eurostat zusammen. Für einzelne Energiearten (Steinkohle, Braunkohle, Erdöl, Erdgas, Benzin, Diesel, leichtes Heizöl, Flüssiggas, Strom, Fernwärme) werden in einem Textteil zunächst kurze Erläuterungen, insbesondere zu Aufkommen und Verwendung sowie zu Preisbildungsmechanismen gegeben.

Statistisches Bundesamt

#GermanEnergyFact #11: hard #coal import prices

Not only 🇩🇪 gas import prices increased a lot in 2022, but also hard coal prices. Again, data provided by the Federal Statistical Office: https://www.destatis.de/DE/Themen/Wirtschaft/Preise/Publikationen/Energiepreise/energiepreisentwicklung-xlsx-5619001.xlsx

▶️ Hard coal import prices in 2022 on average increased nearly by a factor 3 vs. 2021, and by a bit less than factor 5 vs. 2020 (only counting Jan-Nov for consistency)
▶️ This also contributed to increasing electricity prices

(sorry, no graph today, just numbers, as I don't have much time)

Daten zur Energiepreisentwicklung - Lange Reihen bis November 2022

Diese monatlich herausgegebene Veröffentlichung fasst Daten zur Entwicklung der Energiepreise aus unterschiedlichen Statistiken der Gruppe Preise sowie von Eurostat zusammen. Für einzelne Energiearten (Steinkohle, Braunkohle, Erdöl, Erdgas, Benzin, Diesel, leichtes Heizöl, Flüssiggas, Strom, Fernwärme) werden in einem Textteil zunächst kurze Erläuterungen, insbesondere zu Aufkommen und Verwendung sowie zu Preisbildungsmechanismen gegeben.

Statistisches Bundesamt

#GermanEnergyFact #12: household electricity prices

If you are following this thread, you may recall that German wholesale #electricity #prices increased a lot in 2022, largely driven by high natural gas (and also hard coal) prices. This also led to higher household electricity prices. The 🇩🇪 energy industry association #BDEW regularly publishes household electricity price data for a typical household in Germany, with fixed price components also allocated to consumption: https://www.bdew.de/service/daten-und-grafiken/bdew-strompreisanalyse/

BDEW-Strompreisanalyse Oktober 2025

Haushalte und Industrie, Steuern und Beschaffung: So hat sich der Strompreis in Deutschland entwickelt. ►Zur Analyse 2025

#GermanEnergyFact #12 ctd.

So, a few key facts:
▶️ Between 2021 and the second half of 2022, household #electricity #prices increased from around 32 ct/kWh to 40 ct/kWh.
▶️ The relative increase was much lower than the increase in wholesale prices for two reasons:
i) retailers procure electricity up to around 3 years in advance on future markets, so current wholesale price increases are not fully visible yet;
ii) household prices include various other price components, dampening the effects.

#GermanEnergyFact #12 ctd.

▶️ More generally speaking, 🇩🇪 household #electricity #prices include costs for distribution and metering, regulated network charges, and various taxes, levies and surcharges.
▶️ In the years 2013 to 2021, these taxes, levies and surcharges accounted for more than half (!) of the household electricity price.
▶️ In the wake of the current crisis, procurement costs have risen sharply due to high wholesale prices, so the share of taxes/duties/levies fell to under one-third.

#GermanEnergyFact #12 ctd.

▶️ The #EEG levy, which has been charged since 2000 to finance the expansion of renewable energy sources, was abolished on July 1, 2022.
▶️ However, this relief was more than offset by the increase in procurement costs in 2022.
▶️ You can expect that prices continue to increase in 2023, probably to (or above) 50 ct/kWh.

Click- and zoomable graphs and underlying data (also an inflation-adjusted version) in 🇬🇧 , 🇩🇪 and 🇫🇷 in the #openenergytracker: https://openenergytracker.org/en/docs/germany/prices/

Energy prices - Open Energy Tracker

The Open Energy Tracker is a platform to track governmental goals of energy policies.

#GermanEnergyFact #13: gasoline and diesel prices

Not only the prices of gas, coal, and electricity increased a lot in 🇩🇪 in 2022, but also consumer prices for #gasoline and #diesel. Again, drawing on recent data provided by the Federal Statistical Office of Germany #destatis: https://www.destatis.de/DE/Themen/Wirtschaft/Preise/Publikationen/Energiepreise/energiepreisentwicklung-xlsx-5619001.xlsx:

▶️ Average gasoline prices in Germany in 2022 were 23% higher than in 2021, and 50% above 2020 levels.
▶️ Diesel prices on average increased by 40% vs. 2021 and by 74% vs. 2020.

#energymastodon

Daten zur Energiepreisentwicklung - Lange Reihen bis November 2022

Diese monatlich herausgegebene Veröffentlichung fasst Daten zur Entwicklung der Energiepreise aus unterschiedlichen Statistiken der Gruppe Preise sowie von Eurostat zusammen. Für einzelne Energiearten (Steinkohle, Braunkohle, Erdöl, Erdgas, Benzin, Diesel, leichtes Heizöl, Flüssiggas, Strom, Fernwärme) werden in einem Textteil zunächst kurze Erläuterungen, insbesondere zu Aufkommen und Verwendung sowie zu Preisbildungsmechanismen gegeben.

Statistisches Bundesamt

#GermanEnergyFact #14: import prices of #oil, #gas and #coal

I conclude my second week of German #energy facts with another price graph, drawing on recent #destatis data: https://www.destatis.de/DE/Themen/Wirtschaft/Preise/Publikationen/Energiepreise/energiepreisentwicklung-xlsx-5619001.xlsx

▶️ Striking how import prices of gas and coal increased (and recently decreased) largely in parallel in the wake of Russia's attack on Ukraine.
▶️ Oil prices also increased, but much less.
▶️ Note: coal & gas are substitutes in electricity generation to some extent, but oil is hardly used for this in 🇩🇪 .

Daten zur Energiepreisentwicklung - Lange Reihen bis November 2022

Diese monatlich herausgegebene Veröffentlichung fasst Daten zur Entwicklung der Energiepreise aus unterschiedlichen Statistiken der Gruppe Preise sowie von Eurostat zusammen. Für einzelne Energiearten (Steinkohle, Braunkohle, Erdöl, Erdgas, Benzin, Diesel, leichtes Heizöl, Flüssiggas, Strom, Fernwärme) werden in einem Textteil zunächst kurze Erläuterungen, insbesondere zu Aufkommen und Verwendung sowie zu Preisbildungsmechanismen gegeben.

Statistisches Bundesamt

#GermanEnergyFact #14 ctd.

Thanks for following me here until now. If you like, please share your feedback: do you find these German #energy facts useful/interesting/boring? For me, it's actually quite a bit of fun, I force myself to look at some statistics which I might otherwise ignore.

Next week, I might focus on renewable energy. Stay tuned, and enjoy the weekend!

#GermanEnergyFact #15: share of #renewables in the #electricity sector

New data for 2022 provided by @BMWK: https://www.bmwk.de/Redaktion/DE/Downloads/Energie/230102-erneuerbare-energien-ueberblick-zubauzahlen-und-beschleunigungsmassnahmen.pdf?__blob=publicationFile&v=4. Click- and zoomable graph in the #openenergytracker: https://openenergytracker.org/en/docs/germany/electricity/#shares-in-the-power-sector

▶️ The 🇩🇪 government aims for a share of 80% renewable generation in gross electricity consumption by 2030.
▶️ In 2022, this share increased to ~47% according to #BMWK, driven by a better #wind and #solar year, and some expansion of #renewable capacities (particularly solar).

#Energiewende

#GermanEnergyFact #15 ctd.

▶️ In 2020, the share of #renewable generation in gross #electricity consumption already was as high 45.3%, caused by lower electricity demand during the pandemic.
▶️ In 2021, the share decreased to 41.0% because of higher electricity consumption in the wake of the economic recovery, and a relatively poor wind year.
▶️ To reach the 2030 target, the share must grow by more than 4 %-points per year on average from 2021 onwards.

#rampitup #energytransition

#GermanEnergyFact #16: installed capacity of #solar #PV in 🇩🇪

I promised this week would focus on #renewables, so let's continue with solar #photovoltaics capacity, using data published today by #AGEE-Stat / #Umweltbundesamt: https://www.umweltbundesamt.de/themen/klima-energie/erneuerbare-energien/erneuerbare-energien-in-zahlen/monats-quartalsdaten-der-agee-stat. Graphs from the #openenergytracker: https://openenergytracker.org/en/docs/germany/electricity/#solar-pv

▶️ By the end of Nov 22, PV capacity was 66.1 GW.
▶️ The 🇩🇪 government aims for 215 GW by 2030.
▶️ Currently we are on track, but the expansion speed has to increase to meet the 2030 target.

Monats- und Quartalsdaten der AGEE-Stat

Zeitnahe Informationen zur Entwicklung der erneuerbaren Energien im Jahresverlauf sind ein wichtiger Indikator für den Fortschritt der Energiewende. Ergänzend zu den Zeitreihen auf Jahresbasis veröffentlicht die Arbeitsgruppe Erneuerbare Energien-Statistik (AGEE-Stat) deshalb an dieser Stelle Monats- und Quartalsdaten für das laufende Jahr.

Umweltbundesamt

#GermanEnergyFact #16 ctd.

▶️ In Nov 22, this corresponded to 0.78 kW of installed solar #PV capacity per capita.
▶️ The 2030 target of 215 GW relates to a value of 2.6 kW/capita, assuming a constant population.
▶️ The 2040 target of 400 GW (!) implies 4.7 kW/capita. That's quite a lot 💪

#energymastodon crowd: What are the values for you country🌎?

Disclaimer: newer data than Nov 2022 is available from the #BNetzA #Marktstammdatenregister, but not reliable yet because of time lags in reporting.

#GermanEnergyFact #17: installed capacity of #onshore #wind power in 🇩🇪

Let's continue with onshore wind capacity, again using data by #AGEE-Stat / #Umweltbundesamt: https://www.umweltbundesamt.de/themen/klima-energie/erneuerbare-energien/erneuerbare-energien-in-zahlen/monats-quartalsdaten-der-agee-stat. Graphs from the #openenergytracker: https://openenergytracker.org/en/docs/germany/electricity/#wind-energy

▶️ By the end of Nov 22, the installed onshore wind capacity was 57.9 GW.
▶️ The 🇩🇪 government aims for 115 GW by 2030.
▶️ Currently we are below the required expansion path, and the speed has to increase a lot to meet the 2030 target.

#Energiewende

Monats- und Quartalsdaten der AGEE-Stat

Zeitnahe Informationen zur Entwicklung der erneuerbaren Energien im Jahresverlauf sind ein wichtiger Indikator für den Fortschritt der Energiewende. Ergänzend zu den Zeitreihen auf Jahresbasis veröffentlicht die Arbeitsgruppe Erneuerbare Energien-Statistik (AGEE-Stat) deshalb an dieser Stelle Monats- und Quartalsdaten für das laufende Jahr.

Umweltbundesamt

#GermanEnergyFact #18: installed capacity of #offshore #wind power in 🇩🇪

Now, offshore wind, again using data by #AGEE-Stat / #Umweltbundesamt: https://www.umweltbundesamt.de/themen/klima-energie/erneuerbare-energien/erneuerbare-energien-in-zahlen/monats-quartalsdaten-der-agee-stat. Graphs from the #openenergytracker: https://openenergytracker.org/en/docs/germany/electricity/#offshore

▶️ By the end of Nov 22, the installed offshore wind power capacity was 8.1 GW.
▶️ There has been hardly any development for years.
▶️ But now 🇩🇪 really plans to get started with a 30 GW target for 2030.
▶️ In 2023 alone, there will be tenders for an additional 8.8 (!) GW.

Monats- und Quartalsdaten der AGEE-Stat

Zeitnahe Informationen zur Entwicklung der erneuerbaren Energien im Jahresverlauf sind ein wichtiger Indikator für den Fortschritt der Energiewende. Ergänzend zu den Zeitreihen auf Jahresbasis veröffentlicht die Arbeitsgruppe Erneuerbare Energien-Statistik (AGEE-Stat) deshalb an dieser Stelle Monats- und Quartalsdaten für das laufende Jahr.

Umweltbundesamt

#GermanEnergyFact 18 ctd.

That is, Germany will auction more #offshore #wind capacity in 2023 than we currently have. Some kind of #Zeitenwende, if you ask me.

Fun fact: the last auction in September 2022, 980 MW, had a winning bid of exactly 0 ct/kWh: https://www.bundesnetzagentur.de/DE/Beschlusskammern/1_GZ/BK6-GZ/2022/BK6-22-011/Fläche%20N7.2_Bekanntmachung/Bekanntgabeseite.html;jsessionid=7B77119881F4C316887AF897182B1869?nn=709672.

#renewables #Energiewende

Bundesnetzagentur - Ausschreibungen - BK6-22-011

@wpschill

OK.

Let's see - whether it's all talk again or there will be a substantial addition this year.

(It's alwas easy to talk about actions after 2026; what counts, is, what we do now!)

@wpschill
I appreciate your work.
I already know many of the facts, but rather in a rough way, and therefore details, statistics, and charts are very interesting to me.
All in all, it allows for a bigger picture.
@wpschill
What was the impact of uncoordinated gas purchasing and the outbidding of European countries?
@wpschill 130 Liter jet fuel per capita with the majority of people without a single flight at all clearly shows how uneven energy consumption is …

@wpschill
Jet Fuel is no wonder. There was really next to no flights during the covid times and travel was highly restricted.

Just wondering did you ever collect numbers of empty flights during pandemic to keep flight spots?
https://simpleflying.com/ghost-flight-slot-peservation/

@mwfc Thanks! No, I did not collect any such data, I just converted the AGEB data from t to l and then related it per capita. No idea how the average utilization rate of flights developed...

@wpschill
thanks!
To elaborate, you needed to fill 80% of your allocated slots to keep the flight slot next season.
This was relaxed in 2020, 2021.
In 2022 you needed to fullfill 50% again to keep them next season. EU Level. So yes, empty flights to keep the slots happen.

Maybe someone knows a bit more :)

@wpschill

To use the "per capita" value is excactly the adequate way to illustrate this!

Lets think about the amount of this: Only for traffic its some 890 l of fuel (in 2022) per person. More than 2,4 litres each day, including even the babies.

And its all converted to CO2 - more than 2,3 tons/person/yr (and some H2O). Just for heating its additional ~2 tons/pers/yr

(Traffic is the biggest "chunk". followed by heating; 2019 figures)