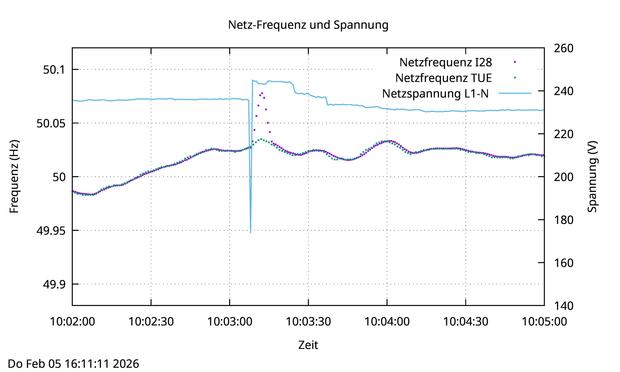
#gnuplot is pretty cool

ウクレレに学ぶ調和の幾何学 〜リサージュ曲線からTonnetzまで〜
https://qiita.com/ken_aizawa/items/f8ea52e54b2661f257bb?utm_campaign=popular_items&utm_medium=feed&utm_source=popular_items
agent-shell v0.47 updates
https://xenodium.com/agent-shell-0-47-1-updates
#emacs #claude #anthropic #ai #google #goose #gemini #linux #github #macos #oss #foss #opencode #codex #vibe #windows #video #youtube #indie #indiedev #gnuplot #mermaid #d2 #charts
A nod of appreciation to gnuplot, which is flexible, simple to use, and very very fast. I'm exploring the results of 40,000 simulation runs, and graphics are produced in less than the blink of an eye.
🦬 New Bending Emacs episode ✨
agent-shell + Claude Skills + Charts
https://www.youtube.com/watch?v=HJQ86HuSIJI
#emacs #claude #anthropic #ai #google #goose #gemini #linux #github #macos #oss #foss #opencode #codex #vibe #windows #video #youtube #indie #indiedev #gnuplot #mermaid #d2 #charts

Pokud jste si někdo, stejně jako já, oblíbil staré meteogramy od ČHMÚ s grafy v #Gnuplot, tak teď jsou tady:
https://intranet.chmi.cz/files/portal/docs/meteo/ov/aladin/results/public/meteogramy/mhtml/m.html

 Qiita - 人気の記事