TunnelScapes

#mathart #Creativecoding #Waterfall #WCCC #WCCChallenge #Mapping #Dataviz

Blog/Image/Code: https://blog.illestpreacha.com/wccc-waterfall

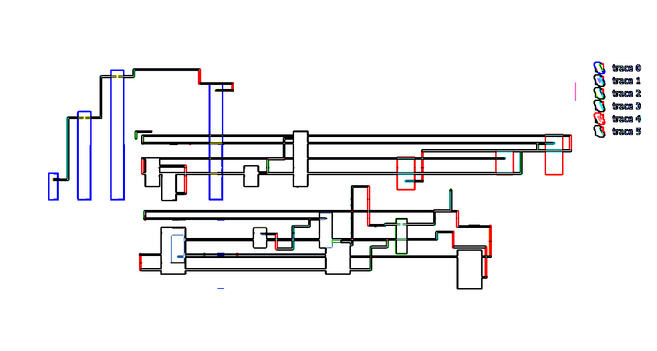
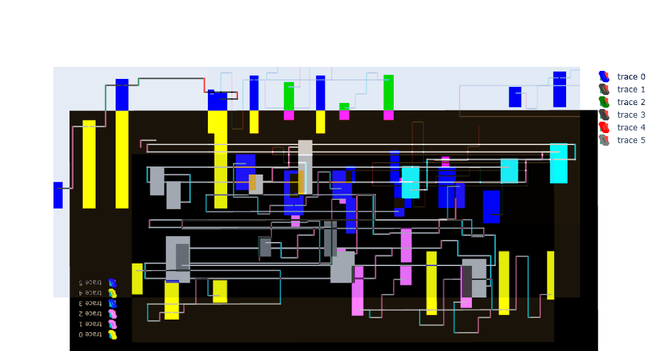
For this week's Creative Code challenge by @sableraph : “Waterfall”, TunnelScapes takes a #Python coded waterfall graph example by Plotly and expands it to speculatively design various TunnelScapes

#Poetry

Inspecting new TunnelScapes
The Excavation of this new Area
Seeking what are the new criterias
For New tunnels to be added
New sections to be the padded
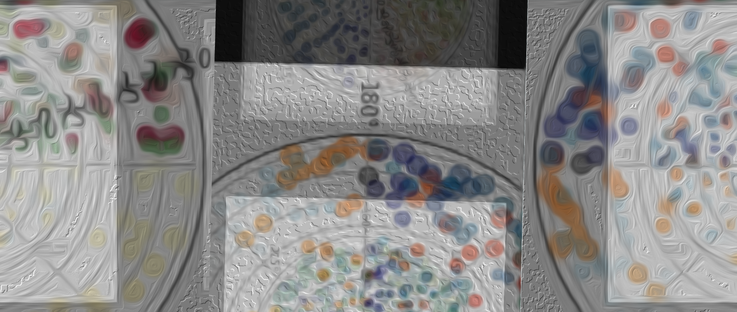
The Necessary Points
For the Mapping these TunnelScapes Joints
That make for various escapes

#creativecoding #coding #graphing
#newmedia #scifi #design #visualpoem
#speculativedesign #geometricart #geometry

I'm looking for suggestions for data visualisation.

Nothing sophisticated but I've not found anything uncomplicated yet.

I need to plot a few time series which in itself is not very complex.

However, I would like to annotate the graph to indicate various events, e.g. with vertical bars from points to the x-axis, and the duration is going to be fairly long. Also, I'd like to both get an overview and look at details.

I've used gnuplot for a bunch of things but never got good results for cases like this, and I don't know how to do annotations to plot events.

So.. any ideas?

#DataVis #Plotting #Graphing #Gnuplot

MisMatchedCircles

Blog/Code/Images: https://blog.illestpreacha.com/genuary2026imperfectcircles

#Genuary #Genuary2026 #Livecoding #Worldbuilding #genuary24 #imperfection #graphing

MisMatchedCircles is coded in #HydraVideoSynth & #Python, Might be a perfectionist nightmare? (Genuary 2026 Prompt 24)

#Poem

As the Code Plots
Where is the location of these dots?
As they don't quite match,
rather they Clash

#creativecoding #coding #animation
#newmedia #dataviz #dataart #dots #circles

PolarPlotting

Blog/Images/Code: https://blog.illestpreacha.com/genuary2026polar

#Genuary #Genuary2026 #Livecoding #Worldbuilding #Genuary10 #polar #graphing

PolarPlotting is coded in #HydraVideoSynth & #Python (plus a filter)
and the polar graph is being used to plot (Genuary 2026 Prompt 10)

#Poem

As the Code Plots
Where is the location of these dots?

#creativecoding #coding #animation
#newmedia #dataviz #dots

Turn your equations into clear, visual graphs in seconds! This free tool makes it easy to paste any math equation and instantly see the plotted result. Perfect for students, teachers, and anyone who loves quick visualization.

Try it here: https://onlinequicktool.com/equation-to-graph/

#MathTools #Graphing #EdTech #STEM #QuickTools #MathMadeEasy

MetaLegendre

Video: https://youtu.be/VZydYSYSEcQ

Blogpost: https://blog.illestpreacha.com/mathober2025orthopolynomials

#mathart #mathober2025 #mathober #mathober27 #Bidiminished #mathober11 #OrthogonalPolynomial

For My 26th Sketch of Mathober2025 (curated by @fractalkitty ) , MetaLegendre is coded with #SonicPi & #Desmos. For the 11th Prompt of Orthogonal Polynomial, uses a desmos sketch that half of the Legendre Polynomials are in 2D and the other half are in 3D. For the 27th Prompt of Bidiminished, the sound is control by the volume of a Metabidiminished Icosahedron.

Poetry

Graphing
Through the Volume
Do the Patterns Resume?
As they await their crafting

#creativecoding #coding #audiovisual
#newmedia #scifi #animation
#math #geometricart #3d #graphing

Mathober2025 Bidiminished+OrthogonalPolynomial : MetaLegendre

YouTube

https://screwlisp.small-web.org/programming/the-heading-problem/

The Heading Problem - looking at how "nested heading levels" which aren't explicitly closed have a dangling-else problem.

More interestingly, I was gnuplotting the "height" of different #lisp forms which was pretty cool. Some notes on #emacs #orgmode #graphing .

I have discovered #python-graph-tool and python-networkx which look like they have more natural primitives for expressing what I'm trying to. #graphing #git
#Grafana ist kein #Monitoring, sondern #Graphing

#climateCrisis #commonLisp #graphing #series #gnuplot https://screwlisp.small-web.org/programming/common-lisp-cl-series-gnuplot-climate/
Hey everyone. I jammed some #declarative #lazyEvaluation #engineering #programming to tie into the climate segment of the live show in TWO hours.

Interesting declarative exploratory programming and super simple gnuplotting if I do say so.

But I basically ran out of time to make a good graph with daily temperature max/min/avg from about 1920-2020 in some weather stations in New Zealand. Any ideas??? Clock is ticking