FOSS Advent Calendar - Door 12: Plotting Like a Pro with Gnuplot
"Reports of my death have been greatly exaggerated."
This quote fits perfectly for Gnuplot, a classic FOSS plotting engine that’s still alive, powerful, and incredibly useful for creating beautiful scientific and mathematical visuals directly from the command line.
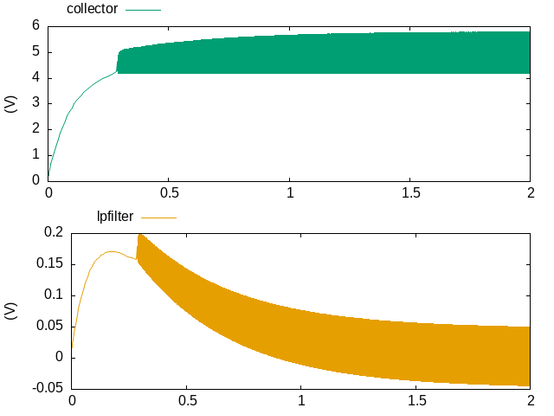
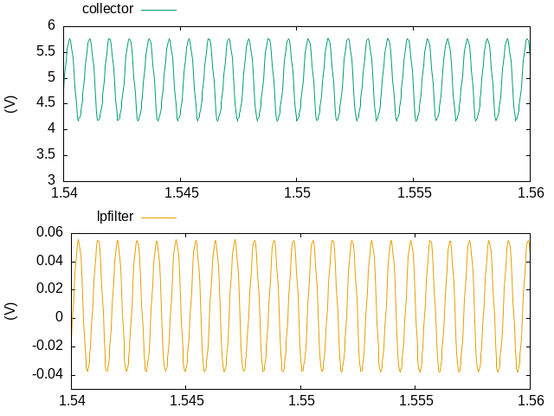
Gnuplot can generate 2D and 3D plots, animate datasets, visualize functions, and export to nearly any format you might need: PNG, SVG, PDF, EPS, and more. And one of its greatest strengths?
You don’t need a whole Python stack, dozens of libraries, or virtual environments just to make a graph. Gnuplot runs instantly, scriptable, lightweight, and beautifully minimal.
Whether you’re analyzing experimental results, visualizing parametric curves, or just plotting a weird math idea you had at 2 AM (we’ve all been there), Gnuplot gets it done fast and clean.
Pro tip: try rendering a dramatic 3D surface plot or a festive math figure, like a parametric Christmas tree. Gnuplot makes it surprisingly easy to turn equations into art.
Link:
https://sourceforge.net/p/gnuplot/gnuplot-main/ci/master/tree/
What’s a plot you’d LOVE to generate with Gnuplot, serious or purely nerdy?
#FOSS #OpenSource #Linux #CLI #Terminal #Gnuplot #DataViz #Plotting #3DGraphics #MathArt #NerdContent #AdventCalendar #OpenTools #FOSSAdvent #CommandLine #ScienceTools #Fediverse #TechNerds #PlottingMagic #adventkalender #adventskalender #DataVisualization #Science #Python #Research #Engineering #AcademicChatter #STEM #Tech #Physics #Chemistry #Maths #SciComm #OpenScience #Research


