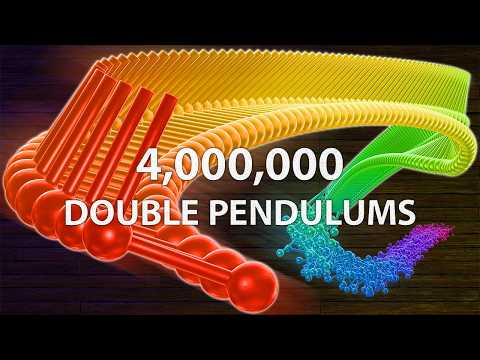
The story of how I developed my contract with myself and its importance to me. Though it isn't easy to do, I recommend you develop your own.
https://www.conferencesthatwork.com/index.php/life-lessons/2023/12/my-contract
The story of how I developed my contract with myself and its importance to me. Though it isn't easy to do, I recommend you develop your own.
https://www.conferencesthatwork.com/index.php/life-lessons/2023/12/my-contract
Released a new 📦 https://github.com/AnandPilania/chartforge — modular, 0-dependency, framework agnostic, SVG charting library that supports bar, line, donut, pie, heatmap, cross hair, stacked, scatter, funnel etc charts and can be use in CLI mode also.
#chart #charts #nodejs #library #package #cli #Pluggable #Sparkline #svg #visualizations #charting #reactjs #vuejs #laravel #angular
I just published my newest project that visualizes #orgdown (#Emacs #orgmode syntax) files in a web browser:
https://codeberg.org/publicvoit/orgheadingnetwork
Similar functionality is included in all sorts of tools like #logseq or #obsidian. I personally haven't found a spot for it in my daily workflows but with that project, I may decide to play around with such visualizations any time.
Have fun
#Design #Visualizations
Why accessibility changes everything · The many ways content can be experienced https://ilo.im/16a9lp
_____
#Perception #Cognition #Attention #Content #Accessibility #WCAG #ProductDesign #UiDesign #UxDesign #WebDesign

We often talk about accessibility as if it were a checklist: contrast ratios, ARIA labels, keyboard navigation, screen readers. But it doesn’t explain why accessibility changes everything. The real issue is this: the same content can create clarity for one person and confusion, stress, or exclusion for another, without changing a single word. Understanding accessibility...
#Design #Mindsets
Design’s 90% problem · Why designers must master explaining what works https://ilo.im/169o1b
_____
#Business #Job #Skills #AI #Visualizations #Justifications #ProductDesign #UxDesign #UiDesign #WebDesign
#Design #Roundups
Best data visualization projects of 2025 · From interactive experiences to thoughtful maps https://ilo.im/169iqu
_____
#Storytelling #Visualizations #DataViz #Maps #Museum #Music #Content #UxDesign #VisualDesign #WebDesign
Joe Davies' personal space on Observable, data visualization and GIS at Eurostat, with maps and explained code for all kinds of experiments and visualizations #visualizations