Scientists See More Vegetation In The Himalayas - But It Is Not Good News, Because That Extra “Green” Can Disrupt Water, Snow, And High-Mountain Biodiversity | Plants Growing Higher Across Himalaya As Climate Warms
(Vegetation On The Move: Elevational Shifts And Greening Dynamics Across The Himalayan Alpine Zone)
--
https://www.ecoticias.com/en/scientists-see-more-vegetation-in-the-himalayas-but-it-is-not-good-news-because-that-extra-green-can-disrupt-water-snow-and-high-mountain-biodiversity/33120/ <-- shared technical article
--
https://news.exeter.ac.uk/faculty-of-environment-science-and-economy/earth-and-environmental-science/plants-growing-higher-across-himalaya-as-climate-warms/ <-- shared technical newsitem
--
https://doi.org/10.1002/ecog.08259 <-- shared (2026) paper
--
https://doi.org/10.1111/gcb.14919 <-- shared (2020) paper
--
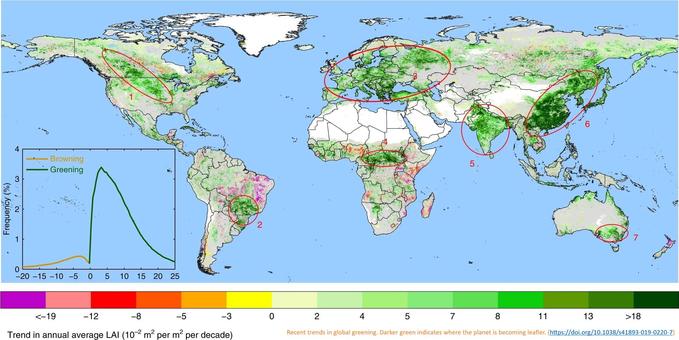
“For years, the biggest climate warning from the Himalaya was easy to picture because glaciers were shrinking on the roof of Asia. Now, researchers are pointing to a quieter signal, one that can look almost harmless from a distance. The mountains are getting greener.
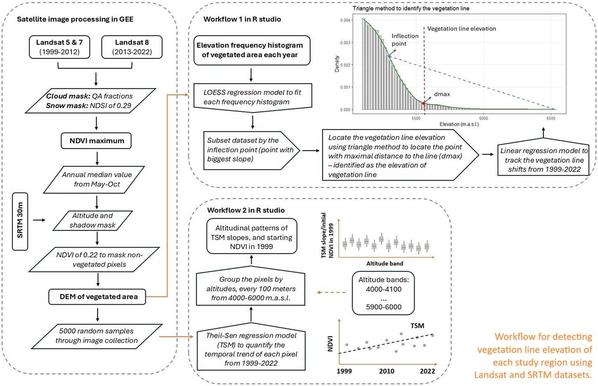
New research [link above] shows alpine vegetation moving higher across six Himalayan regions from 1999 to 2022, pushed in part by warming and reduced snow depth. That might sound like nature recovering, but in this fragile landscape, more plant cover at extreme heights may change how snow is stored, how water runs downhill, and how rivers behave for communities far below…”
#GIS #spatial #mapping #remotesensing #earthobservation #satellite #landsat #landcover #NDVI #Himalaya #Nepal #India #Bhutan #climatechange #glacier #vegetation #alpine #level #greening #spatialanalysis #spatiotemporal #snow #water #ice #hydrography #hydrology #ecosystems #humaninpacts #phenology #model #modeling #HighMountainAsia #greenness #ERA5 #vegetationline #altitude #climatictrends #warming #precipitation #rainfall
(Vegetation On The Move: Elevational Shifts And Greening Dynamics Across The Himalayan Alpine Zone)
--
https://www.ecoticias.com/en/scientists-see-more-vegetation-in-the-himalayas-but-it-is-not-good-news-because-that-extra-green-can-disrupt-water-snow-and-high-mountain-biodiversity/33120/ <-- shared technical article
--
https://news.exeter.ac.uk/faculty-of-environment-science-and-economy/earth-and-environmental-science/plants-growing-higher-across-himalaya-as-climate-warms/ <-- shared technical newsitem
--
https://doi.org/10.1002/ecog.08259 <-- shared (2026) paper
--
https://doi.org/10.1111/gcb.14919 <-- shared (2020) paper
--
“For years, the biggest climate warning from the Himalaya was easy to picture because glaciers were shrinking on the roof of Asia. Now, researchers are pointing to a quieter signal, one that can look almost harmless from a distance. The mountains are getting greener.
New research [link above] shows alpine vegetation moving higher across six Himalayan regions from 1999 to 2022, pushed in part by warming and reduced snow depth. That might sound like nature recovering, but in this fragile landscape, more plant cover at extreme heights may change how snow is stored, how water runs downhill, and how rivers behave for communities far below…”
#GIS #spatial #mapping #remotesensing #earthobservation #satellite #landsat #landcover #NDVI #Himalaya #Nepal #India #Bhutan #climatechange #glacier #vegetation #alpine #level #greening #spatialanalysis #spatiotemporal #snow #water #ice #hydrography #hydrology #ecosystems #humaninpacts #phenology #model #modeling #HighMountainAsia #greenness #ERA5 #vegetationline #altitude #climatictrends #warming #precipitation #rainfall