RE: https://wisskomm.social/@ioer/115899330915763542

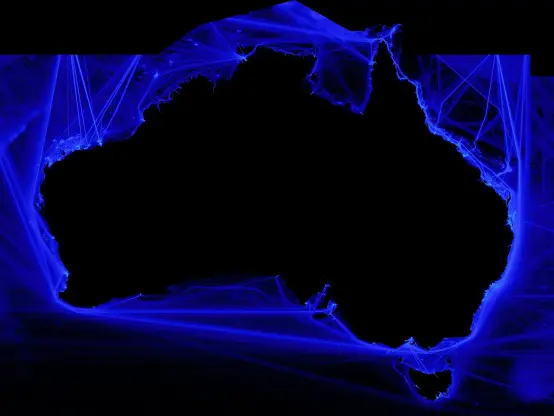
I really took a deep dive into #datashader with this map: Locals & Tourists in Germany, as derived from 67 Million Geo-Social Media Posts (2007-2022) in Germany. The data includes public shared posts from Instagram, Flickr, Twitter and iNaturalist.

I always wanted to create such a map, following the footsteps of Eric Fisher's Locals & Tourists dataset from 2011 [1].

I shared the code for producing this map here [2]. The repository is available here [3]. This includes some neat methods for various #geospatial processing tasks in #Python, such as exporting a datashader map to a #GeoTiff [4] with the help of #Xarray and #Rasterio.

Finally, all of this was created in a privacy-preserving way using #HyperLogLog, which allowed me to share the code and abstracted data publicly for full reproducibility and transparency. [6] #FAIR

Below you'll find the link to the (quite succinct) publication in Natur und Landschaft in Karten (#NuL).

[1]: https://www.flickr.com/photos/walkingsf/albums/72157624209158632
[2]: https://code.ad.ioer.info/wip/digital_traces_map/html/03_visualization.html
[3]: https://gitlab.hrz.tu-chemnitz.de/ad/digital_traces_map/
[4]: https://gitlab.hrz.tu-chemnitz.de/s7398234--tu-dresden.de/base_modules/-/blob/main/raster.py?ref_type=heads#L78
[5]: https://www.nul-online.de/article-7301410-1111/landschaft-und-natur-in-karten-.html
[6]: https://doi.org/10.71830/VDMUWW

Foursquare Open Source Places: A new foundational dataset for the geospatial community

Stay up to date with the latest from Foursquare! Learn more about Foursquare Open Source Places: A new foundational dataset for the geospatial community

Foursquare
“ Tresor Berlin” / “Datashader - Sync Out Off” (1 user) https://www.youtube.com/watch?v=AAmHfWY5b7s #Datashader #YouTube
Datashader - Sync Out Off

YouTube

Creating a big data visualization dashboard/browser app. Is #holoviz and #datashader the way to go? In addition, would you use #plotly or #bokeh or something else for interactive plots? Any other tips?

#datascience #python #visualization

This is a log-scaled heatmap of maritime vessel positions between Sept 2012 and Oct 2023 inclusive, made using data collected from the Australian Maritime Safety Authority Digital Data page and rendered with #Python and the #Datashader package.

For anyone that is interested to play with this data please check this post: https://owenlamont.github.io/home/blog/2023/11/20/plotting-australian-maritime-safety-authority-vessel-positions/ which includes GitHub repo links for both scraping and visualising this data.

Plotting Australian Maritime Safety Authority Vessel Positions - Owen's Home

Maritime vessel position data wrangling and visualisation

@kylebarron neat. How about a comparison with #datashader and #gleo
Heard a nice talk today in #Berlin from Jean-Luc Stevens about #Holoviz at @pyberlin . #hvPlot and #Datashader look like a powerful combination to render large datasets. Jean-Luc works like @sophiamyang for #Anaconda
https://holoviz.org/index.html
High-level tools to simplify visualization in Python — HoloViz 0.16.2 documentation

☯️ #zen3geo v0.6.1. Quick patch release with full support for 🐍 Python 3.11! Made a couple of bug fixes 🐞 to DatashaderRasterizer (for turning points/lines/polygons to pixel masks based on a template raster). Also sneaked in a tiny enhancement ✨ to XpySTACAssetReader (which wraps around `xarray.open_dataset`) to work without xpystac 🙃. Find out more in the release notes at https://zen3geo.readthedocs.io/en/v0.6.1/changelog.html.

@pytorch #TorchData #Python #DataShader #xarray #gischat #geospatial #datapipeline #computervision

Changelog — zen3geo

I love the idea of turning #Jupyter notebooks into slides. I've figured out most issues with rendering interactive plots 👩‍💻 but there is one thing I'm stuck with:

#GeoViews & #Datashader works great in a #notebook but is not not rendered in the slides

The output is: BokehModel(combine_events=True, render_bundle={'docs_json': {'8bb4dc3b-92b9-4d6e-9b03-060b443bfa47': {'defs': …

Any pointers much appreciated

#nbconvert #bokeh #geopandas #holoviz #hvplot #datascience #Dataviz #VisualAnalytics

#30DayMapChallenge Day 24. The constellation of “stars” in the Greater Region of #Luxembourg.
“Stars” are the whereabouts of cross-border commuters from #Belgium, #France & #Germany, working in Lux.
A #datashader experiment using Twitter data from https://doi.org/10.1080/09654313.2022.2108312
Revealing mobilities of people to understand cross-border regions: insights from Luxembourg using social media data

The cross-border practices of people beyond migration and tourism are often overlooked. However, the increase of frequent social interactions and mobilities of people crossing country borders for w...

Taylor & Francis