Sad that #holoviews STILL doesn’t wrap empty histogram bins for a log display by default like it is done in @matplotlib for ages: df.plot.hist(log=True) works but df.hvplot(logy=True) crashes with zeros not allowed (due to empty bins). And I really don’t care that the error is mathematically correct, it’s simply passing reality to insist not fixing this, and I’m convinced things like this are preventing a larger uptake of #hvplot and #holoviews.
*sigh* #bokehplots and/or #holoviews #hvplot still haven't worked out a way to do a histplot with logy=True and empty bins??? Sadness...
for anyone thinking about trying #python312 : #matplotlib , #hvplot , #astropy don't exist yet on #condaforge, but #numpy , #scipy , #pandas are there.
#ExploratoryDataAnalysis trick of the day: linking a scatter plot and a bar plot in #holoviews using DynamicMap (since Linked Brushing -- which is awesome usually -- does not support bar plots)
9 lines of code 😎
https://discourse.holoviz.org/t/linked-brushing-with-bar-chart/6049/2
HT @MarcSkovMadsen whose answer to a related question pointed me towards the right path
Linked brushing with bar chart
Ok, found it thanks to Linked tap selections in stacked bar plots - #2 by Marc and RangeXY — HoloViews v1.17.1 def selected_bar_plot(x_range, y_range): if x_range: tmp = df[(df.x>x_range[0])&(df.x<x_range[1])] else: tmp = df return tmp.groupby("ShipType").count().hvplot.bar(x="ShipType", y='MMSI', width=400, rot=90) map_plot = df.hvplot.scatter(x='x', y='y', c="ShipType", width=700, height=300) rangexy = hv.streams.RangeXY(source=map_plot) map_plot << hv.Dynam...
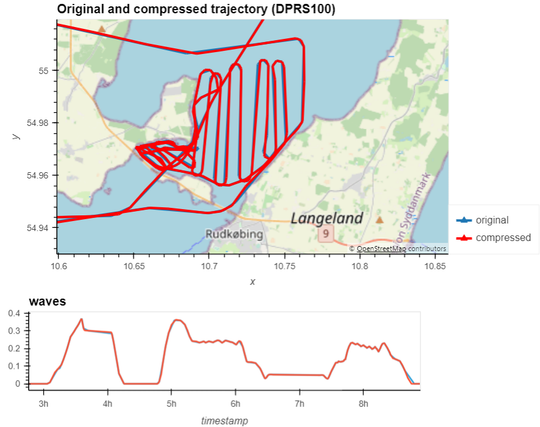
I'm so happy that we're finally in a place where we can whip up a quick trajectory data exploration app with maps and graphs from rather arbitrary inputs, be it plain old csv with x/y in any crs known to proj, or fancy gis formats in just a few minutes.
It's minimal extra effort and seems to impress most people so much more than comparable plots in a notebook 🤷♀️😀
#MovingPandas #panel #hvplot #holoviz #holoviews #geoviews #geopandas #SpatialDataScience #mobilitydatascience #dataviz


🎉 We're happy to announce the release of #MovingPandas 0.17, featuring
✅️ Improved #MFJSON support
✅️ New OutlierCleaner
✅️ Improved #hvplot interactive plots
and more, see:
https://github.com/movingpandas/movingpandas/releases/tag/v0.17
Freshly forged packages 📦 are available now on conda-forge


Public service announcement: pin your #hvplot version to 0.8.3 for now, particularly if you use #geoviews like @movingpandas does

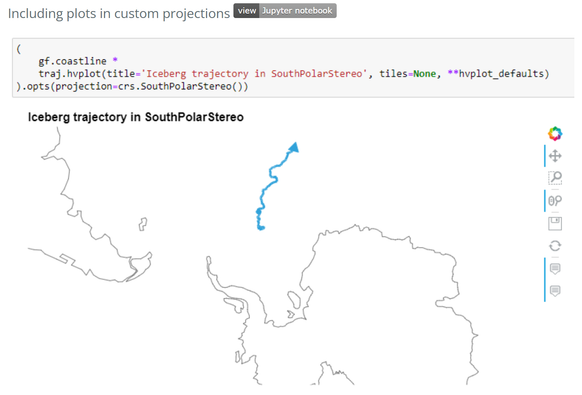
Did you know that @movingpandas supports plotting using custom #projections?
This #HiddenGem feature of #GeoViews is really neat and it's now featured on the update #MovingPandas homepage
#MobilityAnalytics #MovementDataAnalysis #DataScience #DataViz #Holoviews #hvplot
Today, I had the pleasure to present @movingpandas at the #Maritime #Informatics & #Robotics - #Maritime2023 #SummerSchool
https://summer-schools.aegean.gr/Maritime2023
Too bad I couldn't make it there in person, but I do hope that the participants got a good impression of the #Python for #MovementDataAnalytics ecosystem:
#MovingPandas #geopandas #geoviews #hvplot #holoviews
Home | Summer Schools
Spend 10 days in Syros, designing and building a real sea going robot! This summer school is organized by the Intelligent Transportation Systems Lab (Smart MOVE) of the Department of Product & Systems Design Engineering at the University of the Aegean. The goal of the school is to provide an introduction and comprehensive overview of Maritime Informatics and Marine Technology,
Heard a nice talk today in #Berlin from Jean-Luc Stevens about #Holoviz at @pyberlin . #hvPlot and #Datashader look like a powerful combination to render large datasets. Jean-Luc works like @sophiamyang for #Anaconda
https://holoviz.org/index.html
https://holoviz.org/index.html
