“Climate change is now reaching the end-game, where very soon humanity must choose between taking unprecedented action, or accepting that it has been left too late and bear the consequences. Therefore, it is all the more important to listen to non-mainstream voices who do understand the issues and are less hesitant to cry wolf. Unfortunately for us, the wolf may already be in the house.”
- Hans-Joachim Schnellhuber, founding director of the Potsdam Institute for Climate Impact Research [1]
There is a 10% chance, according to #ClimateModels, that we are on course for a total collapse of #Earth's #climate (the #atmosphere - #ocean #ClimateSystem) - 6°C of #GlobalWarming above #PreIndustrial (pre-1750) levels [1]. Which is what 700 ppm atmospheric #CO2 would bring. We are projected to reach 700 ppm CO2 in 2075 (and 950 ppm by 2100) [2]. This would mean not only #EconomicCollapse and complete breakdown of #human #society, but a 6th #MassExtinction of nearly all #species. And very likely near extinction of humans. Would you board an aircraft that you knew had a 10% #probability of crashing? Well, the #IPCC and most mainstream scientists apparently would. 38% of the denizens of #Mastodon who responded to a poll I did the other day would at least consider boarding an aircraft with a 1% chance of crashing. If 1% of aircraft flights ended in a crash, that would mean over 1,000 crashes per day. At 10% probability of a crash it would be 10,000 per day. Unthinkable, right? Apparently not. Not when it comes to playing with the earth's #climate. There's still a 90% chance of this not happening, after all, the IPCC reasons. So it is not “very likely”, not even “likely”. This represents ignorance of #risk and #RiskAnalysis, ignorance of the way #probability and #statistics works in #ComplexSystems, ignorance of #FatTail probability distributions, ignorance of the fact that all #NaturalSystems are complex systems, which by their nature are subject to #TippingPoints – and a bizarre belief that the #NormalDistribution (the so-called #BellCurve) applies to natural systems, which it decidedly does not. Allow me to elaborate.
A couple of days ago, I ran a #ClimateCrisis #poll masquerading as a poll asking if you would board an aircraft which you knew had a 1% chance of crashing. The hints that this poll was allegorical were the #Climate hashtags and the link to the straightforward climate poll I ran in parallel with it.) As to the latter, which asked “Can we ignore unlikely but high risk #GlobalWarming scenarios?”, 80% of respondents to both the German and English versions said “Absolutely Not! We risk annihilation of #Earth!” Only 7% picked “the #IPCC ignores these [scenarios]. Me too.” This closely mirrors a statistically valid poll of 14,000 adult German citizens published in August 2021 in which 74% of people responded that humanity is about to face an #ecological #catastrophe [3]. But surprisingly (shockingly?) 20% of respondents to the “aircraft crash” poll said they would board the aircraft even if they knew there was a 1% chance of it crashing, and 18% said they weren't sure and “would have to think about it” (94 people responded to the “aircraft” poll, 45 to the “climate” poll). Which means 38% of people would at least consider boarding such a plane. Very bad idea.
Now #Mastodon polls are in no way statistically valid (but then neither are many commercial polls that get touted by news organizations). Nonetheless, the results are very illuminating when it comes to how the IPCC, #governments, #business, and indeed the #ScientificCommunity are dealing, or rather not dealing, with the fact that there is not a 1% probability but a 10% chance that #humans have put our planet on a trajectory in which #humans and most #species may well become #extinct sometime in the 22nd Century. And #SocietalCollapse will likely happen later in our present century. The level of ignorance of #probability and #statistics in #NaturalSystems, specifically the #ocean - #atmosphere system – demonstrated by the IPCC and many mainstream scientists shockingly parallels the ignorance of these same subjects by 38% of the respondents to the “aircraft poll”. (For one thing, there are projected to be about 40,000,000 aircraft flights in 2023 [4]. If there were a 1% chance of a crash, that would mean 400,000 crashes this year, or over 1000 crashes per day. And yet, when we look dispassionately at the #ClimateScience, we are treating the very real models of human-caused global-warming (Anthropogenic Global Warming, or #AGW) as if we've intentionally boarded an aircraft that has a 10% chance of crashing. Which would mean 10,000 aircraft crashes every day. Unthinkable, right? Surely no one would ever board an aircraft if this were the case.
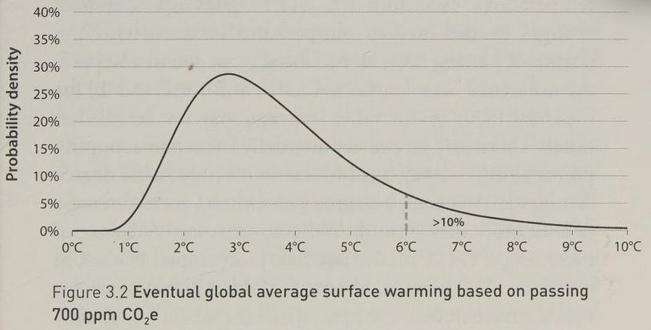
In the case of Earth's climate, what would constitute a “crash”, the complete collapse of human society, nearly complete #MassExtinction of most terrestrial species, a broad band (± 20° latitude north and south of the equator) of our #oceans at hot tub temperatures, and an even broader band (± 30° N/S of the equator) which would be uninhabitable for humans, and large regions even further north and south (the #American #Southwest, the interior of #Australia, most of the #Mediterranean, #Arabia, #Spain, #Portugal, #India, #Pakistan, the south of #France, to name a few) which would be uninhabitable during the summer months? Scientists agree that 6°C of global warming above #PreIndustrial (before 1750 CE) would certainly do it; quite possibly less than that, due to positive #FeedbackLoops, but let's be conservative, like most scientists, and go with 6°C. What are the chances of that? Well, the chance of 6°C of warming within the next 100 years is 10%!
Here is an excellent graphic (see attached screenshot) from the economists Gernot Wagner's and Martin Weitzman's 2015 book “Climate shock: the economic consequences of a hotter planet” [5] (well worth a read, by the way). That doesn't quite look like a Normal distribution, does it? A pretty wonky looking “bell curve”. That's because the statistics that underlie the curve are not Normally distributed. It is not a bell curve. A Normal distribution is based upon the statistical concept known as the Central Limit Theorem #CentralLimitTheorem, and the Law of [Statistical] Universality which arises from it. And that law works great – when it is applied to data whose variables do not interact with each other or with other systems, when there are no higher order interactions of variables, when there are no #FeedbackLoops, etc. If you're looking at a distribution of the heights or weights of 1000 randomly selected #penguins, or people, the data will be Normally distributed, it will follow a “bell curve”, because the Central Limit Theorem tells us it will be so, and the Law of Universality must apply. But none of this is true for natural systems, whether a #biome, an #ecosystem, or the ocean-atmosphere system that is (primarily) responsible for Earth's climate. There is another kind of statistical universality, indeed a statistical law of universality, that applies to all complex systems, and thus all natural systems, called Tracy-Widom Universality (first elaborated in 1992 by the mathematicians Craig Tracy and Harold Widom) [6]. The statistical distributions that arise from Tracy-Widom Universality are not symmetrical “bell curves” but skewed distributions with “fat tails”. Exactly that of the statistical likelihood of reaching or exceeding 6°C of global warming as shown in Wagner's and Weitzman's figure.
Are we totally screwed? Or rather, have we totally screwed ourselves and the planet? As of now, it certainly looks that way. And perhaps we are collectively okay with this. There is after all a 90% chance we won't reach or exceed 6°C of warming. But even the mainstream climate science community acknowledges we are headed for 3°C - 4°C of global warming, and headed there very soon, which will probably be more than enough to set off the collapse of the climate, of the atmospheric and ocean circulation system. And a single species, in about 300 years time, will have managed to destroy the bluest and greenest and most living of planets, 4.5 billion years in the making. It is simply not right.
[1] https://www.breakthroughonline.org.au/whatliesbeneath
[2] https://yaleclimateconnections.org/2019/06/data-from-earths-past-holds-a-warning-for-our-future-under-climate-change/
[3] https://www.fom.de/2021/august/deutschlandweite-fom-umfrage-zur-klimakrise.html
[4] https://www.statista.com/statistics/564769/airline-industry-number-of-flights/
[5] https://archive.org/details/climateshockecon0000wagn/page/53/mode/1up?view=theater
[6] https://www.quantamagazine.org/beyond-the-bell-curve-a-new-universal-law-20141015/
#Klimakrise #Klimawandel #Klima #Erderwärmung #Erderhitzung #Atmosphäre #Ozean #Klimamodell


 AI底層數據建模