This course is aimed at researchers who want to gain confidence in using R and tidyverse for data analysis and visualisation. Over three days, we’ll cover data wrangling, plotting with ggplot2, and creating reproducible reports with Quarto.
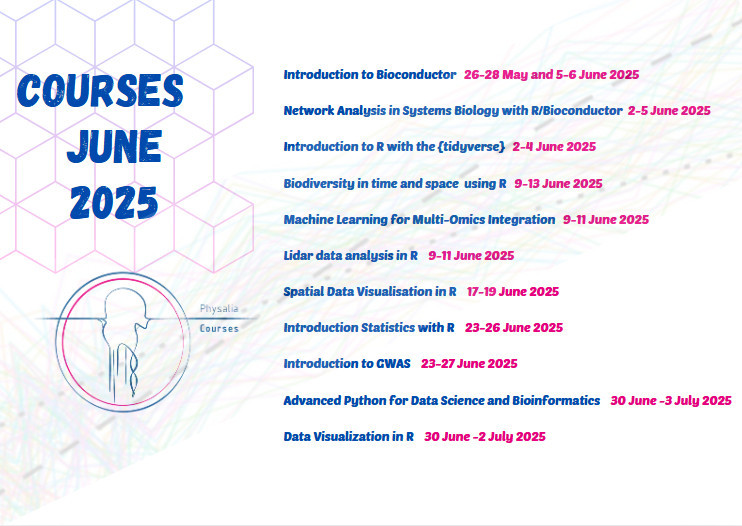
https://www.physalia-courses.org/courses-workshops/r-tidyverse/