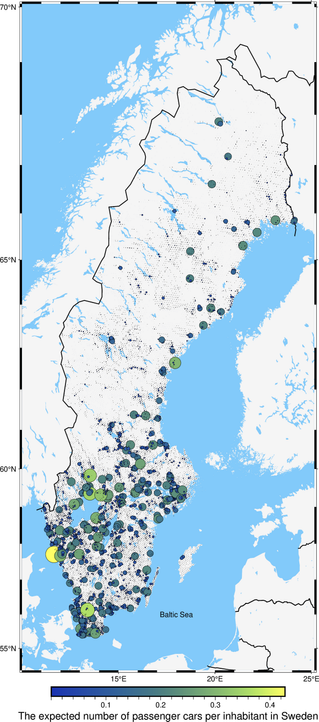
đŸ—ș Geostatistics in action: the expected number of passenger cars per inhabitant in Sweden.

🍏 Raw data sources are the population grid, the number of registered passenger cars in each Swedish municipality, and the number of inhabitants in each municipality.

đŸ”Ș Data preprocessing was done in #QGIS and #geopandas

đŸ„— Area-to-point support transformation was done in #pyinterpolate

đŸ» Visualization in #pygmt

Overall #Python score: 10/10 🐍

The unexpected (stable) release of #pyinterpolate - 0.5.0, named after the Ukrainian Mykolaiv city

The problems with dependencies and Python==3.7 EOL forced this release. It is slightly polished. I've removed annoying warnings and changed the tutorials' structure. I spent a lot of time with grammar checks, and I hope that the sentences in tutorials are closer to the valid English language 😅

Changelog: https://github.com/DataverseLabs/pyinterpolate/blob/main/changelog.rst

Pypi: https://pypi.org/project/pyinterpolate/

pyinterpolate/changelog.rst at main · DataverseLabs/pyinterpolate

Package with spatial analysis and spatial prediction tools - DataverseLabs/pyinterpolate

GitHub

The newest stable release of #pyinterpolate
is out! Version 0.4 introduces new concepts:

- Indicator Kriging 📊 ,
- Spatial Dependence Index 📈 ,
- Gridding 🌐 ,
- Point clusters detection and aggregation đŸŸ .

This release is named after the city of Kharkiv in Ukraine.

I will post all upcoming updates within this thread. Stay tuned!

#spatial #gis #python #datascience #geospatial

The new release of #pyinterpolate for #spatial, #geospatial, #gis, #mapping is out. It has been a significant change in Poisson Kriging algorithms used for areal data interpolation and transformation, and now interpolation errors are an order of magnitude lower than in the past releases. Release 0.3.6 closes some chapters of development, and release 0.3.7 will be devoted mostly to CI/CD, dependencies, and documentation, then we skip to version 0.4 with indicator kriging.

Public data can be irritating. Let's consider a scenario when we build a #machinelearning model that uses #remotesensing data, and we need to mix it with #social, #publichealth, or #economic indicators aggregated over counties. It is not possible.

But, in some cases, we can transform aggregates into high-resolution input. When and how?

The steps are presented in the article here: https://ml-gis-service.com/index.php/2022/12/09/get-more-from-crime-rate-data-and-other-socio-economic-indicators-with-pyinterpolate/

We transform county aggregates of crime rates.

#pyinterpolate #Python #gis #spatial

Get more from Crime Rate data and other socio-economic indicators with Pyinterpolate – Sp.4ML

New release of #pyinterpolate! Version 0.3.5, and:

- the package is computationally stable (no more `LinAlgErrors` in #Kriging system, or even if they are raised, the users will know what went wrong),
- a lot of optimization,
- emphasis put on directional variograms.

#spatial #gis #python #opensource #openscience #datascience

The following steps: directional Poisson Kriging and more tutorials in the documentation.

#introduction

Hi, I'm Simon! I'm Data Scientist and #DataEngineer specializing in #remotesensing, #GIS, #spatial, #ecommerce, #timeseries, and duo of #Python + #opensource :)

Living in Europe đŸ‡ȘđŸ‡ș You can catch me in Helsinki / Vantaa đŸ‡«đŸ‡ź Polish nationality đŸ‡”đŸ‡±

Creator of #pyinterpolate package: https://pypi.org/project/pyinterpolate/ for Kriging and spatial interpolation đŸ—ș

#wsknn package for session-based recommendations: https://pypi.org/project/wsknn/ 🛒

pyinterpolate

Spatial Interpolation in Python

PyPI