Originally from Hristo H. here: https://www.linkedin.com/posts/hristo-sv-hristov_quantitativefinance-tradingstrategies-backtesting-activity-7449676947430965250-sFQ4
The 9 Deadly Sins of Backtesting (and How to Fix Them) - Part I
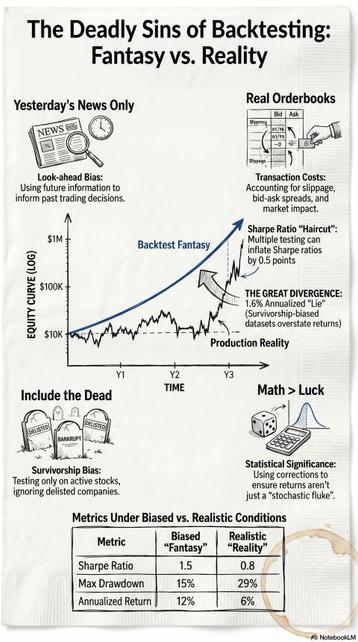
Many trading strategies do not fail because of unforeseen market events; they fail at their inception—specifically, the moment the researcher ceases to maintain absolute rigor in the backtesting environment. The fundamental premise of successful quantitative research is not the discovery of clever signals, but the systematic and ruthless elimination of bad ideas through the identification of false positives. On paper, you see a clean equity curve; in production, the profits disappear.
1. Survivorship Bias:
This error occurs when a researcher focuses exclusively on assets that have survived a selection process while overlooking those that did not, leading to a sample that is fundamentally unrepresentative of the historical population. For example, a momentum strategy applied to the S&P 100 can yield a 26% CAGR, but once failed and delisted companies are reintegrated, the edge plummet to 12.2%. In the Nasdaq 100, the discrepancy is even more extreme, with drawdowns exploding from 41% to 83% when "forgotten" losses are included. Fix: Point-in-time (PIT) data. This means using a database that reproduces the exact information available at the historical moment, ensuring you only trade assets that were actually listed and tradable on that specific day.
2. Forward-Looking Bias:
Often called "trading with tomorrow's newspaper," this involves incorporating information into a signal that would not have been available at the moment of execution. A primary culprit is backward price adjustment: if a stock trades at $100 on Jan 1 and splits 2:1 on Feb 1, a backward-adjusted dataset will rewrite the Jan 1 price to $50. Any signal using a price filter on Jan 1 effectively "knows" the split is coming. Fix: Use raw prices for signals and forward price adjustment (anchoring to the first available date) for performance measurement to maintain temporal integrity.
3. Transaction Costs:
Many strategies show a small edge that evaporates once realistic costs are applied. Standard OHLCV data often suffers from "outlying" values due to small orders at regional exchanges and cannot capture the reality of market depth or slippage. Fix: Use Transaction Cost Analysis (TCA) benchmarks like Arrival Price—the mid-quote price at the moment the order is submitted—and model non-linear market impact that grows with your order size.
4. Statistical Significance:
In finance, we routinely accept discoveries where the t-statistic exceeds 2.0, yet a 10-trade "hot streak" is often just a stochastic realization of noise. Relying on small sample sizes provides a distorted picture of a strategy's true predictive power. Fix: Look for hundreds or thousands of independent "bets" across the timeline. Use a t-stat > 2.0 as a bare minimum requirement to ensure results are unlikely to have occurred by chance.
To be continued ...
#QuantitativeFinance #TradingStrategies #Backtesting #DataScience #FinTech #AlgorithmicTrading