Sustained strength above 55,200 with high momentum would nullify the Evening Star setup and revive bullish bias toward 59,600 levels.
📉 Bearish Scenario:
If the bearish Evening Star pattern plays out completely, a continued decline toward 52,500, followed by 50,000–49,500, looks probable.
A sustained breakdown below 49,500 would confirm a deeper correction, targeting 47,000–46,800.
#Trading #Investing #Stocks #TechnicalAnalysis
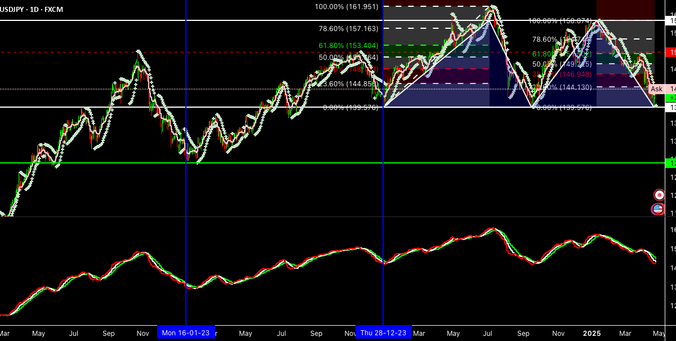
If the index fails to hold above 16,000 and sustains below 15,800 on closing basis, the Inverted Head and Shoulders setup would fail, leading to extended downside toward 15,200–15,000 levels. This would temporarily negate the bullish bias.
If Nifty fails to defend the 23,400 support zone and sustains below it, a deeper correction toward 23,000 or even 22,500 could materialize. This would neutralize the breakout attempt and bring the index back inside the broader range, calling for cautious positioning.
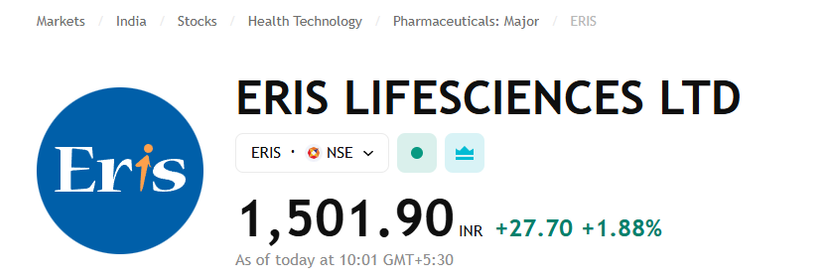
📊 Cash Breakout Alert – ERIS Lifesciences Ltd
💸 Price: ₹1501
Check the setup and review the price action – volume, structure, and momentum look solid.
📥 For detailed chart analysis: ✅ Follow🔁 Retweet 💬 Comment
#TechnicalAnalysis #BreakoutStock #ERIS #StockMarket #TradingView #CashStock
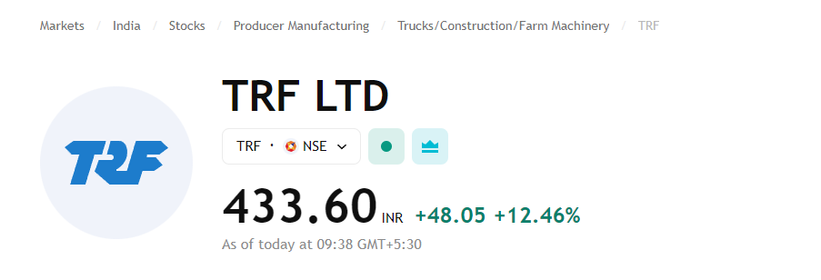
📊 Homework: TRF Ltd (₹430)
Steps to practice:
1️⃣ Support & Resistance
2️⃣ Volume
3️⃣ Gaps
4️⃣ Candlestick Patterns
5️⃣ Multi-Timeframe Analysis
6️⃣ Alert Point
7️⃣ Final Conclusion
🔗 Analysis Link:
https://in.tradingview.com/chart/TRF/6ZQm8p6u-TRF-Ltd-Descending-Channel-Pattern-Breakout/
📥 Follow + Retweet/Comment if helpful!
#TechnicalAnalysis #TradingView
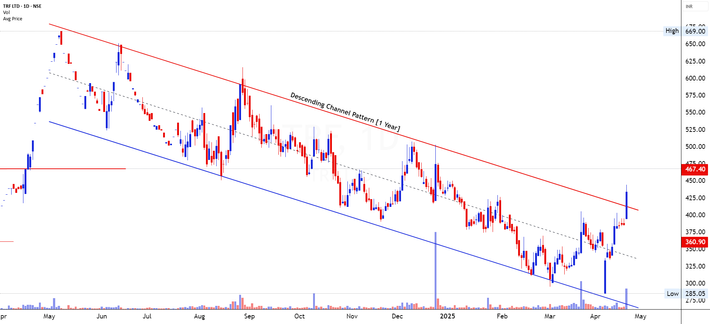
TRF Ltd- Descending Channel Pattern Breakout for NSE:TRF by Mr_Chartist_
Weekly Chart- https://www.tradingview.com/x/DGbOdCta/ 1. Pattern Analysis TRF LTD currently showcases a powerful confluence of three distinct bullish patterns across varying timeframes, making the setup especially notable. On the monthly chart, we identify a Rounding Bottom pattern spanning an impressive 13 years. This rare and robust pattern has finally transitioned into the breakout phase, confirming a long-term structural reversal from its historic lows. The neckline breakout occurred …
