Geospatial Analysis of Urban Population Model Discrepancies Through Land Use and the Built Environment - A Case Study of Croatia
--
https://doi.org/10.3390/geographies6020043 <-- shared paper
--
H/T Olga Bjelotomić Oršulić
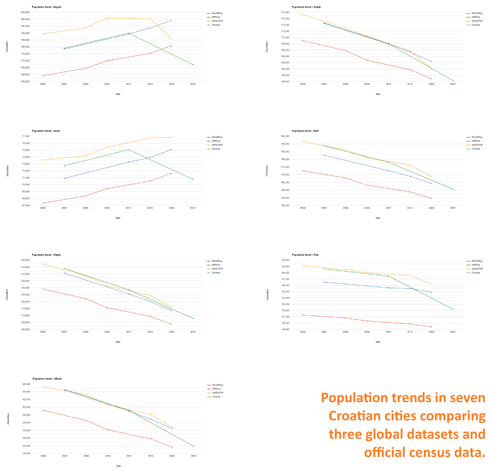
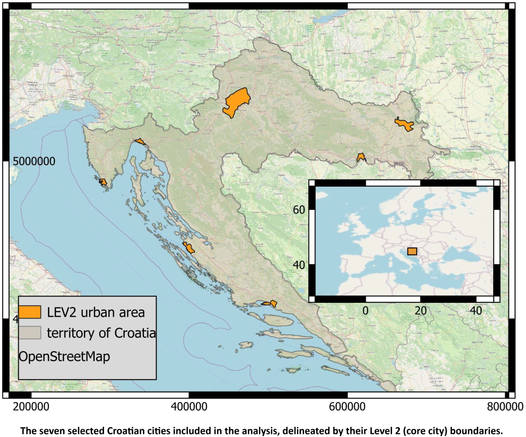
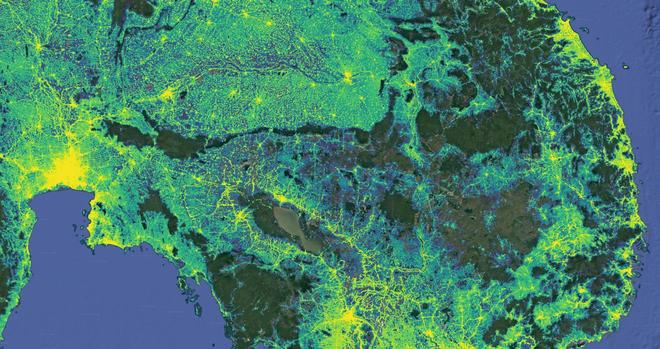
“Using official Croatian census data as a reference, [the researchers] analysed three global population datasets across seven Croatian cities to investigate how population allocation differs between built-up and non-built-up areas.
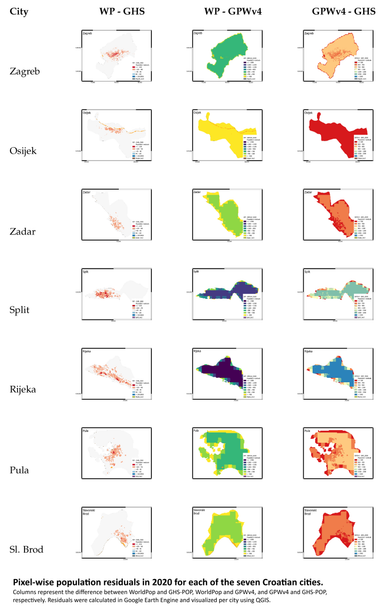
Although the datasets often produced similar population totals, their spatial allocation differed substantially. GHS-POP concentrated over 1 million more inhabitants within built-up areas, while WorldPop allocated approximately 290,000 more inhabitants to non-built-up land-cover classes, demonstrating how similar population totals can mask substantial differences in spatial population patterns.
The question is not only how many people are estimated, but also where the model places them…”
#GIS #spatial #mapping #gridded #population #urban #dataanalysis #shrinkingcities #census #censusvalidation #WorldPop #GHSPOP #GPWv4 #builtupareas #sustainability #SDG #casestudy #Croatia #spatialanalysis #spatiotemporal #SustainableDevelopmentGoals #populationdecline #demographics #urbanplanning #planning #city #cities #PopulationData #RemoteSensing #UrbanAnalytics #OpenData #SDG #model #modeling #urbanisation #density #QGIS #landcover
@MDPI
--
https://doi.org/10.3390/geographies6020043 <-- shared paper
--
H/T Olga Bjelotomić Oršulić
“Using official Croatian census data as a reference, [the researchers] analysed three global population datasets across seven Croatian cities to investigate how population allocation differs between built-up and non-built-up areas.
Although the datasets often produced similar population totals, their spatial allocation differed substantially. GHS-POP concentrated over 1 million more inhabitants within built-up areas, while WorldPop allocated approximately 290,000 more inhabitants to non-built-up land-cover classes, demonstrating how similar population totals can mask substantial differences in spatial population patterns.
The question is not only how many people are estimated, but also where the model places them…”
#GIS #spatial #mapping #gridded #population #urban #dataanalysis #shrinkingcities #census #censusvalidation #WorldPop #GHSPOP #GPWv4 #builtupareas #sustainability #SDG #casestudy #Croatia #spatialanalysis #spatiotemporal #SustainableDevelopmentGoals #populationdecline #demographics #urbanplanning #planning #city #cities #PopulationData #RemoteSensing #UrbanAnalytics #OpenData #SDG #model #modeling #urbanisation #density #QGIS #landcover
@MDPI