learning graphviz today and boy there's a lot of different ways to make random squiggly lines between boxes for no good reason

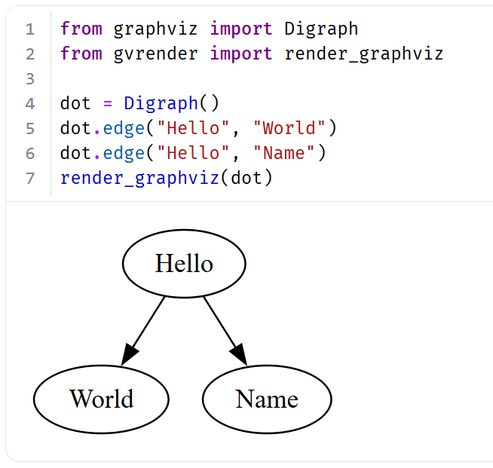
Ever wanted to render Graphviz graphs in the browser with pure Python? Now you can 🐍🌐
Check out the WebAssembly-powered package gvrender! 👇 #Python #WASM #Graphviz
Check out the WebAssembly-powered package gvrender! 👇 #Python #WASM #Graphviz
I recently more often view generated SVGs in #Emacs
- build system task dependency graph like https://codeberg.org/harald/pythonbuilder#dependency-graph-of-pythonbuilder-s-build
- class dependency graph for a TypeScript project generated from https://github.com/PSeitz/ts-dependency-graph
In both cases it would be great if clicking on a node would result in some emacs command being called.
Any ideas?

Silly question for the static webpage people here…
I want to put together a documentation webpage for a system that a few of us have developed. This isn't API documentation, but rather end-user documentation. Some of it will discuss deployment instructions, but there'll be a lot of diagrams and screenshots. I'll host a copy of it, but it will probably also get shipped with the application.
For source-code documentation, I quite like using Doxygen, since it can integrate well with `graphviz` and `mscgen`. `graphviz` is good for showing state transition diagrams, and `mscgen` is great for displaying how messages are passed between systems.
It's good being able to define the diagram *in the text* and have a diagram generated in its place. Makes things a lot easier to maintain.
Doxygen though doesn't work so well without source code. That's 99% of what it does, parse source code for docstrings and format them.
At work I had a similar situation, my employer had chosen to use Hugo, and I needed `graphviz`, the kludge taken there was to use client-side JavaScript to render the diagram. I'd like to avoid that here.
Is there a static website generator out there that can take a block of text in my markdown, and use `graphviz`/`mscgen` to place a diagram in its place?
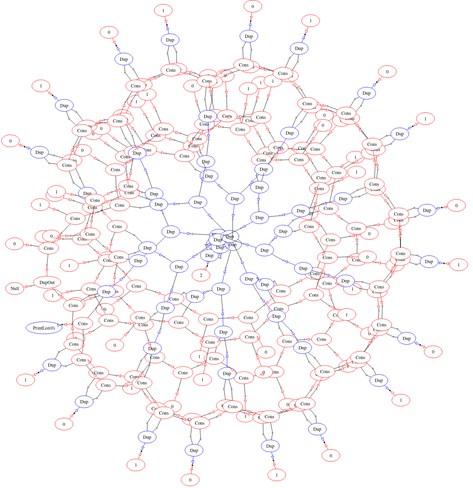
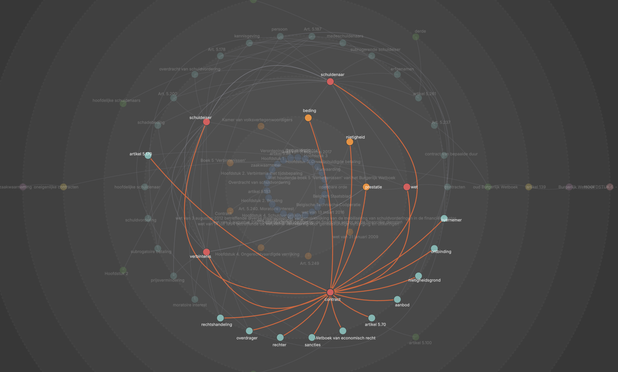
The Knwler hairball graph visualization (Cytoscape) has been replaced by a custom layout algorithm and SVG rendering.The layout now depicts much more clearly the relationships. The concentric circles and fading edges (proportional to distance) are organized according to degree and minimize crossings.
Hope you like it.
https://github.com/Orbifold/knwler
#GraphViz #KnowledgeGraphs
Hope you like it.
https://github.com/Orbifold/knwler
#GraphViz #KnowledgeGraphs
Книга в Markdown: Автоматическая сборка статического сайта mdBook и файла DOCX с оформлением по ГОСТ
Текст книг, учебных пособий, научно-технических статей, документации, дипломных и курсовых работ часто набирается и редактируется в WYSIWYG-редакторе, таком как Microsoft Word, в том числе вследствие того, что издательства и организации требуют от авторов оформленный по ГОСТ или внутренним стандартам docx-документ. Процесс работы в Microsoft Word и аналогичных редакторах не лишён недостатков: docx-файлы трудно версионировать в git, а для объединения нескольких документов в один придётся перенумеровывать источники, рисунки, таблицы, формулы. Альтернативой docx является LaTeX. Однако работа со стилями в LaTeX простотой и минималистичным синтаксисом не отличается , причём издательства от использования формата docx отказываться не торопятся. А инструменты в духе typst отличаются нестандартным синтаксисом языка для описания документов, причём возможность генерации сайтов в typst имеет пометку «in preview». Markdown — популярный и удобный язык разметки, но это также и очень ограниченный формат. Поэтому задача написания в Markdown сложной технической документации по ГОСТ, научной статьи с автоматической настройкой оформления для заданного издательства или хорошо оформленного онлайн-учебника может показаться неосуществимой. В этой статье рассмотрим способ работы над научно-техническими статьями и книгами в формате Markdown на основе подхода Docs as Code с учётом строгих ограничений на оформление, используемый Петром Советовым @true-grue и мной при подготовке учебных материалов в РТУ МИРЭА. Способ заключается в применении утилиты pandoc для построения дерева абстрактного синтаксиса (AST) Markdown-документа с последующим переписыванием AST набором фильтров на Lua и трансляцией AST в форматы docx и pdf, соответствующие ГОСТ, а также в диалект markdown, совместимый с mdBook , для генерации онлайн-учебника в виде статического сайта. Исходный код книги , написанной с использованием описанного в статье подхода, опубликован на GitHub.
https://habr.com/ru/articles/987982/
#pandoc #markdown #lua #python #документирование #гост #docx #graphviz #mdbook #github

Книга в Markdown: Автоматическая сборка статического сайта mdBook и файла DOCX с оформлением по ГОСТ
Текст книг, учебных пособий, научно-технических статей, документации, дипломных и курсовых работ часто набирается и редактируется в WYSIWYG-редакторе, таком как Microsoft Word, в том числе вследствие...
Having the freedom to chose my work environment on the computer, I move more and more tasks to Emacs recently, like running terminal windows with https://codeberg.org/harald/terminal-frame . Another pet of mine is my python build system: https://codeberg.org/harald/pythonbuilder
The latter can produce a nice SVG graph, using #graphviz, of the dependency tree of the build setup.
And should I forget which targets the build has, it is just a C-x C-f dependencies.svg away to see that graph.😀

On day 11, both parts were quite simple: counting paths required a DFS with cache.
On part 2, the cache was different… unless one had an epiphany to solve it using part 1 because the input graph was a Direct-Acyclic-Graph: therefore ensuring one of fft->dac or dac->fft would have no paths; the solution would be paths(svr->fft)×paths(fft->dac)×paths(dac->out).
Yet I did not think of this, and that's despite using the first minutes actually plotting the input: