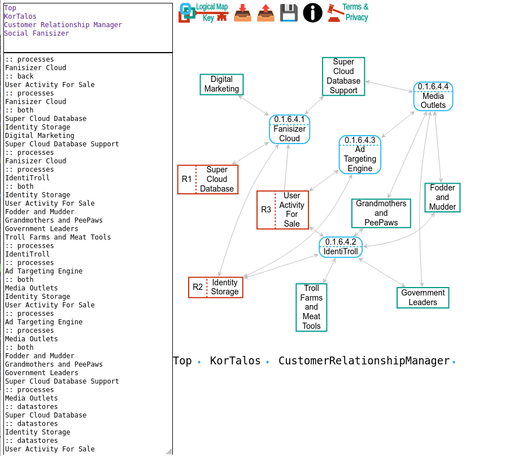
New release for GruPHst v0.16.0 a rust in-memory graph database.
Now with Graphviz export!
https://github.com/carvilsi/gruphst?tab=readme-ov-file#graphviz
#rust #GraphDatabase #inMemoryDatabase #persistence #rustLibrary #graphviz #dataViz
Technically, we can perform this #upgrade across all the environments in parallel, or in any order we choose. At least that’s what the #dependency #graph says. (Thank you #graphviz!)
Organizationally, it would be a terrible idea. There are well-established #reasons for keeping #production last in the list. They would not fit within the approximately one-third of a toot I have remaining.
Tune in next week for another episode of “Can versus Should.”
All new files my old `btrfs` filesystem creates are above 32-bit inode space:
$ touch a && stat '-c%i' a
11833717710
Very occasionally I build 32-bit `i686-linux` packages. Sometimes they fail to run against file with so large inodes.
Two casualties today:
- `doxygen`: https://github.com/doxygen/doxygen/pull/11518
- `graphviz`: https://gitlab.com/graphviz/graphviz/-/merge_requests/4269
@rlonstein Very cool!
I use #graphviz all the time in m #orgmode notes. I didn' tknow about #gnuplot support though. Amazing
Seems Graphviz creates graphs in 3D. Not too readable when everything is a mess for my dead simple graph. Fortunately there's only about 6500 properties to go through one by one to check. Not too impressed.
Hackers' Pub에서 DOT 언어(Graphviz)로 다이어그램 그리기

Hackers' Pub에서 DOT 언어(Graphviz)로 다이어그램 그리기
Hackers' Pub의 숨겨진 기능 중 하나는 Graphviz의 DOT 언어를 지원한다는 것입니다. 예를 들어, 다음과 같은 다이어그램을 그릴 수 있습니다: SimpleActivityPub server_a 서버 A (Mastodon) server_b 서버 B (Hackers' Pub) server_a->server_b ActivityStreams 데이터 전송 (HTTP POST) server_b->server_a 응답 및 상호작용 (HTTP POST) Graphviz를 이용하는 법은 간단합니다. Markdown의 코드 블럭 문법 안에 DOT 언어로 다이어그램을 기술하신 뒤, 코드 블럭의 언어 태그에 graphviz를 붙이시면 됩니다. 위에서 예를 든 다이어그램은 Markdown에서 아래와 같이 쓰면 됩니다: ```graphviz digraph SimpleActivityPub { graph [rankdir=LR, fontname="sans-serif", bgcolor="white"]; node [fontname="sans-serif", shape=box, style="rounded,filled"]; edge [fontname="sans-serif"]; server_a [label="서버 A\n(Mastodon)", fillcolor="#AED6F1"]; server_b [label="서버 B\n(Hackers' Pub)", fillcolor="#A3E4D7"]; server_a -> server_b [label="ActivityStreams 데이터 전송\n(HTTP POST)", color="red"]; server_b -> server_a [label="응답 및 상호작용\n(HTTP POST)", color="blue"]; } ``` 참고로 Graphviz는 긴 게시글 뿐만 아니라 단문에서도 똑같이 지원합니다.
