Your #process #data holds early warnings—#LabPlot (#free, #opensource) turns them into clear #statistical alerts, so you act before issues escalate.

Unlike complex tools, LabPlot's #StatisticalProcessControl tools are designed for quick, reliable #insights.

Using #SPC, reductions in the process #variation of 50% are not unusual.

Try it now:
1. Download: https://labplot.org/download.
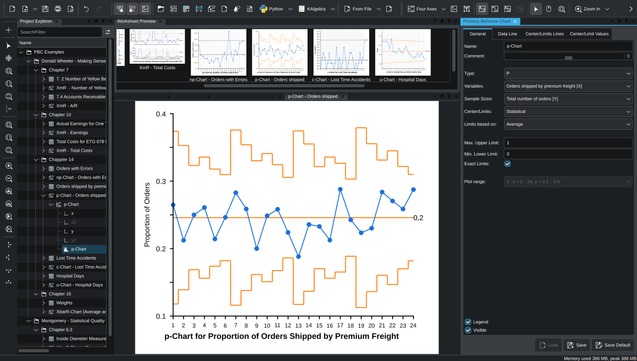
2, Add a #ControlChart.
3. Act on #facts.

#DataAnalysis #DataViz #Statistics #Business #Chemistry #Physics #Health

Shewhart individuals control chart - Wikipedia

A new feature has been recently merged into the dev branch of #LabPlot - the new visualization type: Run Chart.

@[email protected]

The screenshot below shows the comparison between a Process Behavior Chart (XMR) and a Run Chart.

Read more about Run Charts:
https://en.wikipedia.org/wiki/Run_chart

#LabPlot #DataAnalysis #DataVisualization #Science #Statistics #Quality #SPC #ControlChart #FLOSS #FOSS #OpenSource #Business #FreeSoftware #Researchers #XmR #Deming #Lean #SixSigma #Wheeler

Run chart - Wikipedia

A new feature has been recently merged into the dev branch: Process Behavior Charts (Control Charts of #Shewhart Charts) - XmR, XbarR, XbarS 📈 🚀

@[email protected]

Process behavior charts are a statistical process control tool used to determine if a process is in a state of control.

➡️ https://en.wikipedia.org/wiki/Control_chart

#LabPlot #DataAnalysis #DataVisualization #Science #Statistics #Quality #SPC #ControlChart #FLOSS #FOSS #OpenSource #Business #FreeSoftware #Researchers #XmR #Deming #Lean #SixSigma #Wheeler

Control chart - Wikipedia