Sometimes It Ends Up Just Being Pretty Dots
If the data resolution is not there, it is not there.
Archive: ia: https://s.faithcollapsing.com/sf9rt
https://s.faithcollapsing.com/pq5o9#science #barometric-pressure #weather

Sometimes It Ends Up Just Being Pretty Dots
Sometimes it just ends up being pretty dots.
I keep trying to find new and different ways to look at and predict barometric weather data due to the way that it tends to correlate with me being in pain. Hell of a motivator, you know?
Some of the ways have been more successful than others. I want to tell you about this one for two reasons:
Where I live, pressure fronts typically travel from west to east, going across Illinois and Indiana before reaching Ohio. That meant that, in theory, I should be able to get barometric pressure data from OpenWeatherMap for stations west of me, and actually be able to see the “waves” of barometric pressure in the air. After all, my graphs from the barometric pressure from my phone clearly demonstrate when fronts move through.
I got a sampling of 175 stations in a strip going from me to the Mississippi River, created a script to record the barometric pressure from all of them without exceeding the free tier’s API limits, and did an initial collection run. Once I had that, getting some interesting and useful plots was the next challenge.
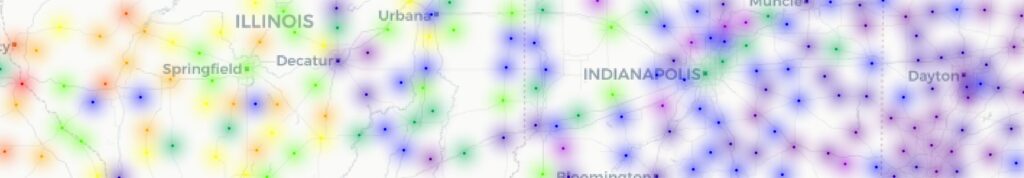
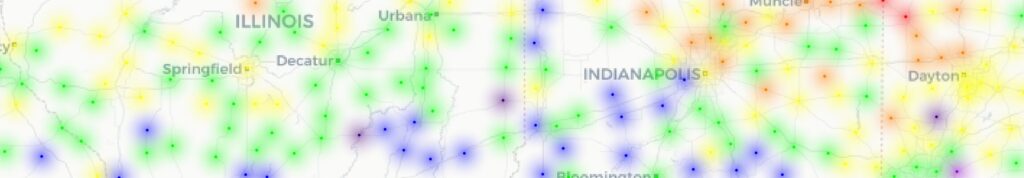
And it sure looked like it was going to be a success. Not only could you kind of see the colors (or height) as representing the pressure, but you could also see change over time.
Those two renders are from data 24 hours apart, so of course they were different. It was time to turn on the data collection full-time, render a bunch of “frames” in the background, and then combine them at the end.
It’s worth noting that I am compressing and simplifying a lot of experimentation and frustration at getting the renders to overlay the map properly.
So after another 24-odd hours, I was not happy at seeing that I hadn’t thought things through.
At first glance, it seems like it worked. But… both the Z-axis and the colors used were relative to the data for each frame. Whoops.
So I needed to go back and make it standardized across the whole data set.
And that’s when I realized the other, bigger problem: scale and resolution.
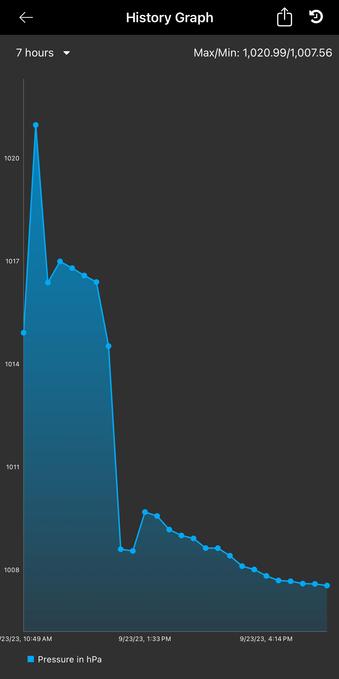
The reason my graphs from the data from my phone look so dynamic — this is the last 36 hours from when I’m writing this, which includes some storms weather moving in early this morning — fits into only two of those blocks on the Z-axis of the chart above.
I am currently sampling the barometric pressure to the hundred thousandths every two minutes. The data I have access to from OpenWeatherMap is updated every 15 minutes (on average), and is whole integers only. So when I plotted the data I had gathered from OpenWeatherMap… it’s basically just showing us the barometric pressure’s “tides” from the heating and cooling of the atmosphere from the sun, not the pressure changes from weather systems that I was hoping to see.
It’s interesting, and it’s pretty, and it definitely gets the idea across that the atmosphere is a dynamic thing over our heads, but it’s not really useful, either. It also took FOREVER to render.
Unfortunately, this isn’t something I can fix, not even by narrowing the dataset of stations I sample from. The data from my phone’s sensor is a lot “noisier” than the data from OpenWeatherMap. I have to be careful to not read meaning into random noise, and to smooth out the data from my phone a bit.
But because I have collected the data with greater precision, I can smooth it (or not) as needed to eliminate noise. But there is no way for me to get greater resolution from data when it doesn’t exist.
That doesn’t mean the pattern is not there. It doesn’t mean the pattern is there, either.
It means we cannot say for sure with the current data that we have.
Luckily, the phone I’m using to record barometric pressure does have enough sensitivity to let me see the pattern.
But it’s an important reminder that our conclusions are only as good as our data.
This goes for all sorts of data, whether it’s barometric pressure or sociological and psychological studies that did not record and control for the subject’s neurotype.
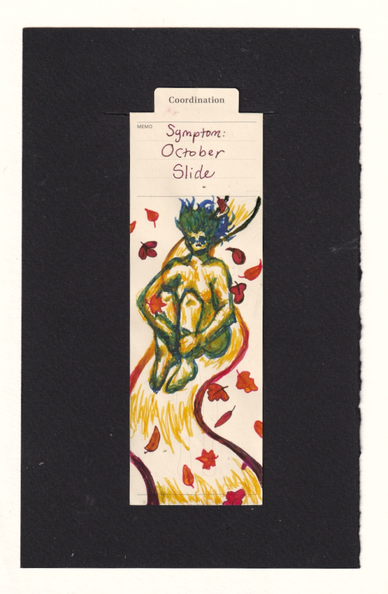
Featured Image by Enrique from Pixabay
#barometricPressure #weather
Symptom: October Slide
Here we post on Crip Time.
For folks in the Southern Hemisphere, maybe this will be in time for your Fall Slides? What month do y’all celebrate your horrors in?
https://www.illmarks.com/symptom-october-slide/
#art #Autumn #BarometricPressure #bodyHorror #bodyMapping #chronicIllness #chronicIllness #chronicPain #CripTime #Fall #longCovid #longcovid #medicalArt #MillionsMissing #octoberslide #pwLC #pwme #Seasons #Spring

Molly is finally off my neck and Scooby is only touching me with a paw instead of full body, so I think I will be leaving the warmth of my bed in the near future.
And then heading right back if I can't find my migraine meds. #brainstorm #barometricpressure trigger


Hosts Marvin Cash and expert fly fisher Mac Brown explore fishing strategies for fluctuating weather conditions in this episode of The Articulate Fly. Hear Mac explain how major drops in barometric pressure make trout sluggish and tough to catch. Learn how trout become more active once the pressure stabilizes at a low level. Mac shares tips for tempting neutral trout with slow jigging techniques. Discover why brown trout get more aggressive as the barometer starts rising, while rainbows grow more stubborn. For seasoned advice on adapting your approaches to changing pressure fronts, don't miss this insightful Casting Angles chat. Sign Up for Mac's Fundamentals of Casting All Things Social Media Follow Mac on Facebook, Instagram and Twitter. Follow us on Facebook, Instagram and Twitter. Support the Show Shop on Amazon Become a Patreon Patron Subscribe to the Podcast or, Even Better, Download Our App Download our mobile app for free from the Apple App Store, the Google Play Store or the Amazon Android Store. Subscribe to the podcast in the podcatcher of your choice.
I'm a really weird bird and record the #weather in my #journal every day, including the #BarometricPressure.
It is 1034 mbars here right now. That is HIGH. 😳 I have no one who will get that in my vicinity, but we're usually in the high teens-low twenties (e.g., 1021 mbars). It's falling, but very slightly.
No real rain in two months and super high pressure makes for a beautiful day, yes, but it is the opposite of what my #garden needs. Ah well.
It’s been. A day.
Fall in the Midwest is something, but tropical storms on the East Coast are something else entirely.
Been mostly bumming around the house today as the rain pours down. Hoping for better knees tomorrow.
Going to bed with the start of a pain that is clearly going to be 11× worse upon waking is shit for a few reasons, but today will feel about 60 hours long as a result of the bad sleep that I managed last night. The right side of my head feels like it’s on fire, yet simultaneously submerged deep under water. All because of a change in the weather.
Barometric pressure is a wanker and doesn’t have any friends. Pass it on.
#FuckMigraine #ChronicFatigue #ChronicMigraine #BarometricPressure
@lunar_fang Changes around low pressure weather cause bad things to happen in my head. Sometimes it can feel like someone has pumped several gallons of sea water into my skull, or like my head is submerged 500m into a load of sewage.