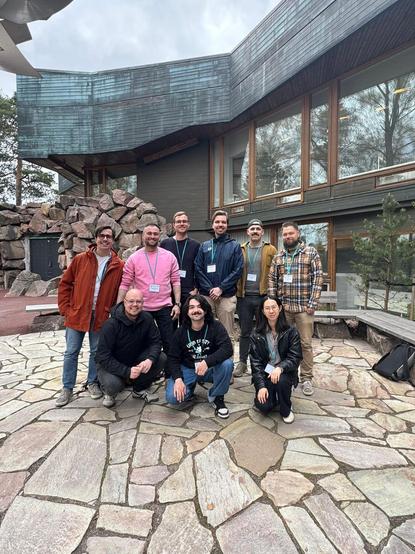
Quite many from @digigeolab were at the #LBS2025 conference last week presenting our work on #Mobility #GIScience #Geography and #GeoAI, and we wrote a small blog post on it.
Digital Geography Lab
@digigeolab@mastodon.online
- 574 Followers
- 1,036 Following
- 297 Posts
Interdisciplinary research lab at the University of #Helsinki , #Finland. Spatial big data analytics on a human scale for fair and sustainable societies. Lead by @tuuli #openscience
The second day of #LBS2025 conference is about to start, and so is the onslaught of presentations from @digigeolab members and alumni on topics like #mobility #BigData #GIScience #MachineLearning #NatureRecreation #Segregation #EcosystemServices #Geography
I have the dubious honor of the very last presentation of the day, acting as the firewall between the scientific program and the conference dinner. Let's see how many turn up 😅
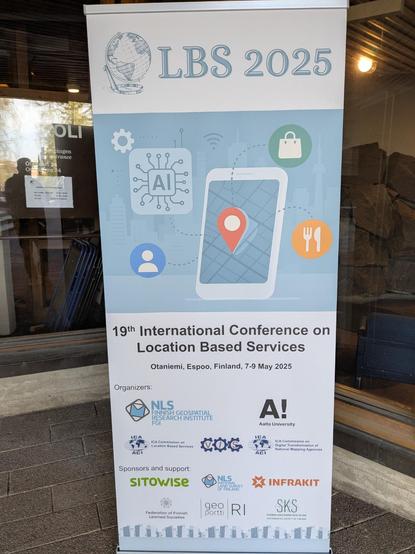
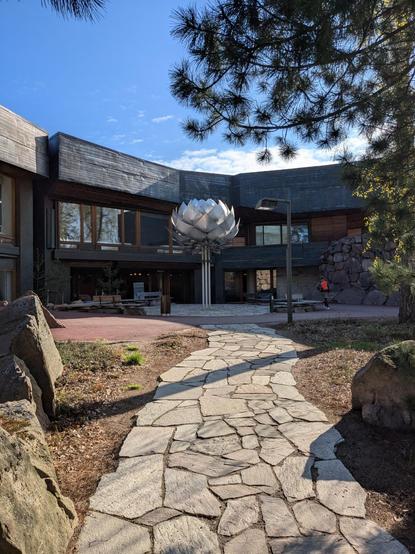
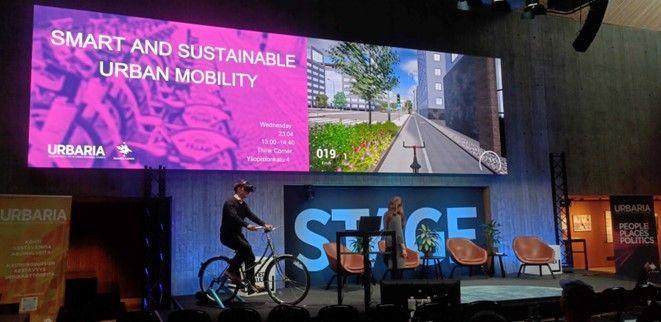
The 19th Location Based Services conference #LBS2025 is about to start in #Espoo at #AaltoUniversity.
I am presenting tomorrow, so today I get to chillax 😎 We have a very good representation from @digigeolab
Exciting milestone for our GREENTRAVEL team!!
We’ve officially wrapped up data collection for our VR cycling experiments—with an impressive 151 participants 🚴♀️
Juulia Lehtinen explains more 👉 https://blogs.helsinki.fi/digital-geography/2025/04/29/finalising-the-data-collection-for-the-virtual-reality-cycling-experiments-a-pit-stop-worth-celebrating-for-the-greentravel-project/
Now it’s time to dive into data analysis with fresh excitement!
Mobility viewpoint needs to be recognized in urban greening policies! 🚴🌳🏙️
New #GREENTRAVEL paper out!
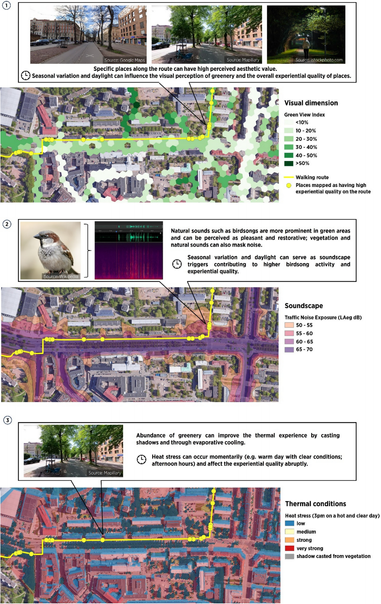
A perspective paper by Silviya Korpilo et al., published in Ambio, describes how people’s contact with urban nature often happens when moving through space.
Interested? Read the paper here 👇
https://doi.org/10.1007/s13280-025-02178-w
Restoring nature, enhancing active mobility: The role of street greenery in the EU’s 2024 restoration law - Ambio
This article argues for the importance of integrating a mobility perspective into urban greenspace planning and practice related to the 2024 EU Nature Restoration Law. Street greenery can play an important multifunctional role in promoting ecosystem services and functions, sustainable mobility, and human health and well-being. However, planners need more evidence on how street vegetation affects health and well-being during everyday active mobility, as well as what type, where and for whom to enhance vegetation. We discuss current advancements and gaps in literature related to these topics, and identify key research priorities to support restoration policy and practice. These include: moving beyond dominant scientific thinking of being in place to moving through space in understanding greenery exposure and experience; use of multiple exposure metrics with attention to temporal dynamics; integration of objective and subjective assessments; and investigating further the role of street greenery in reducing environmental injustices.
The onset of spring in Helsinki always inspires and energizes us, as do the amazing researchers who come to visit us! We're delighted to introduce Eline Rega, a PhD researcher from KU Leuven in Belgium who visits us this April! 🤩
Eline works to generate novel insights into how green space impacts human health and wellbeing. 🌲 🏡🏥 🌲
Learn more from Eline herself 👉 https://blogs.helsinki.fi/digital-geography/2025/04/03/meet-eline-rega-a-phd-researcher-from-ku-leuven/
📢 New master's thesis finalised! 🎉 🎉 🎉
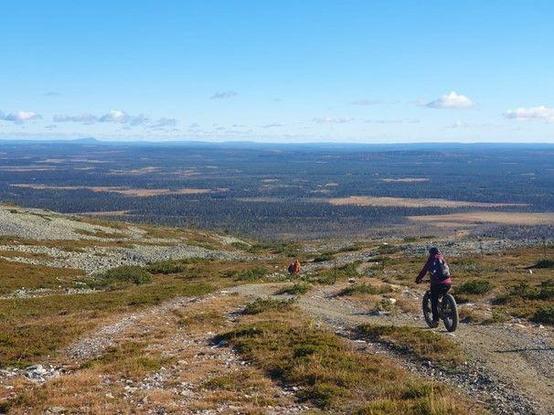
"Activity tracking data for protected area visitor monitoring: A case study of mountain biking using Strava Metro" by Mikko Kangasmaa 😍
🎓 Find the thesis here: https://helda.helsinki.fi/items/73ae8773-c8bd-4835-a599-c52f38f61b6b
📄 Find Mikko's summary here: https://blogs.helsinki.fi/digital-geography/2025/04/03/activity-tracking-data-for-protected-area-visitor-monitoring-a-case-study-of-mountain-biking-using-strava-metro/
🚨 NEW ARTICLE 🚨
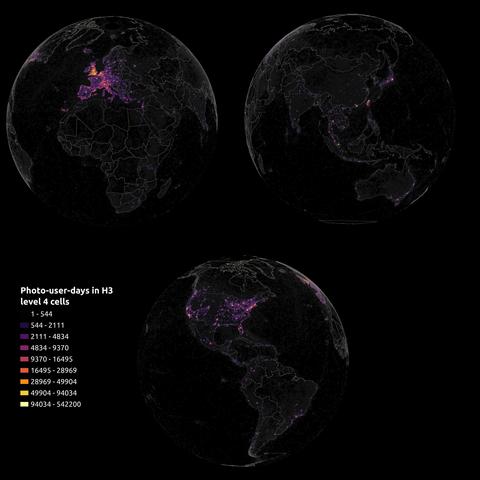
How many photos are uploaded to Flickr? Where? By who? Why does any of it matter? We explore the rise and fall of #Flickr in this @digigeolab paper by yours truly, Vuokko Heikinheimo, @eklund_jo, Anna Hausmann & @tuuli – now out in the Journal of Outdoor Recreation and Tourism.
Article: https://authors.elsevier.com/sd/article/S2213-0780(25)00026-X
Thread 👇
🚨🌍 NEW ARTICLE 🌍🚨
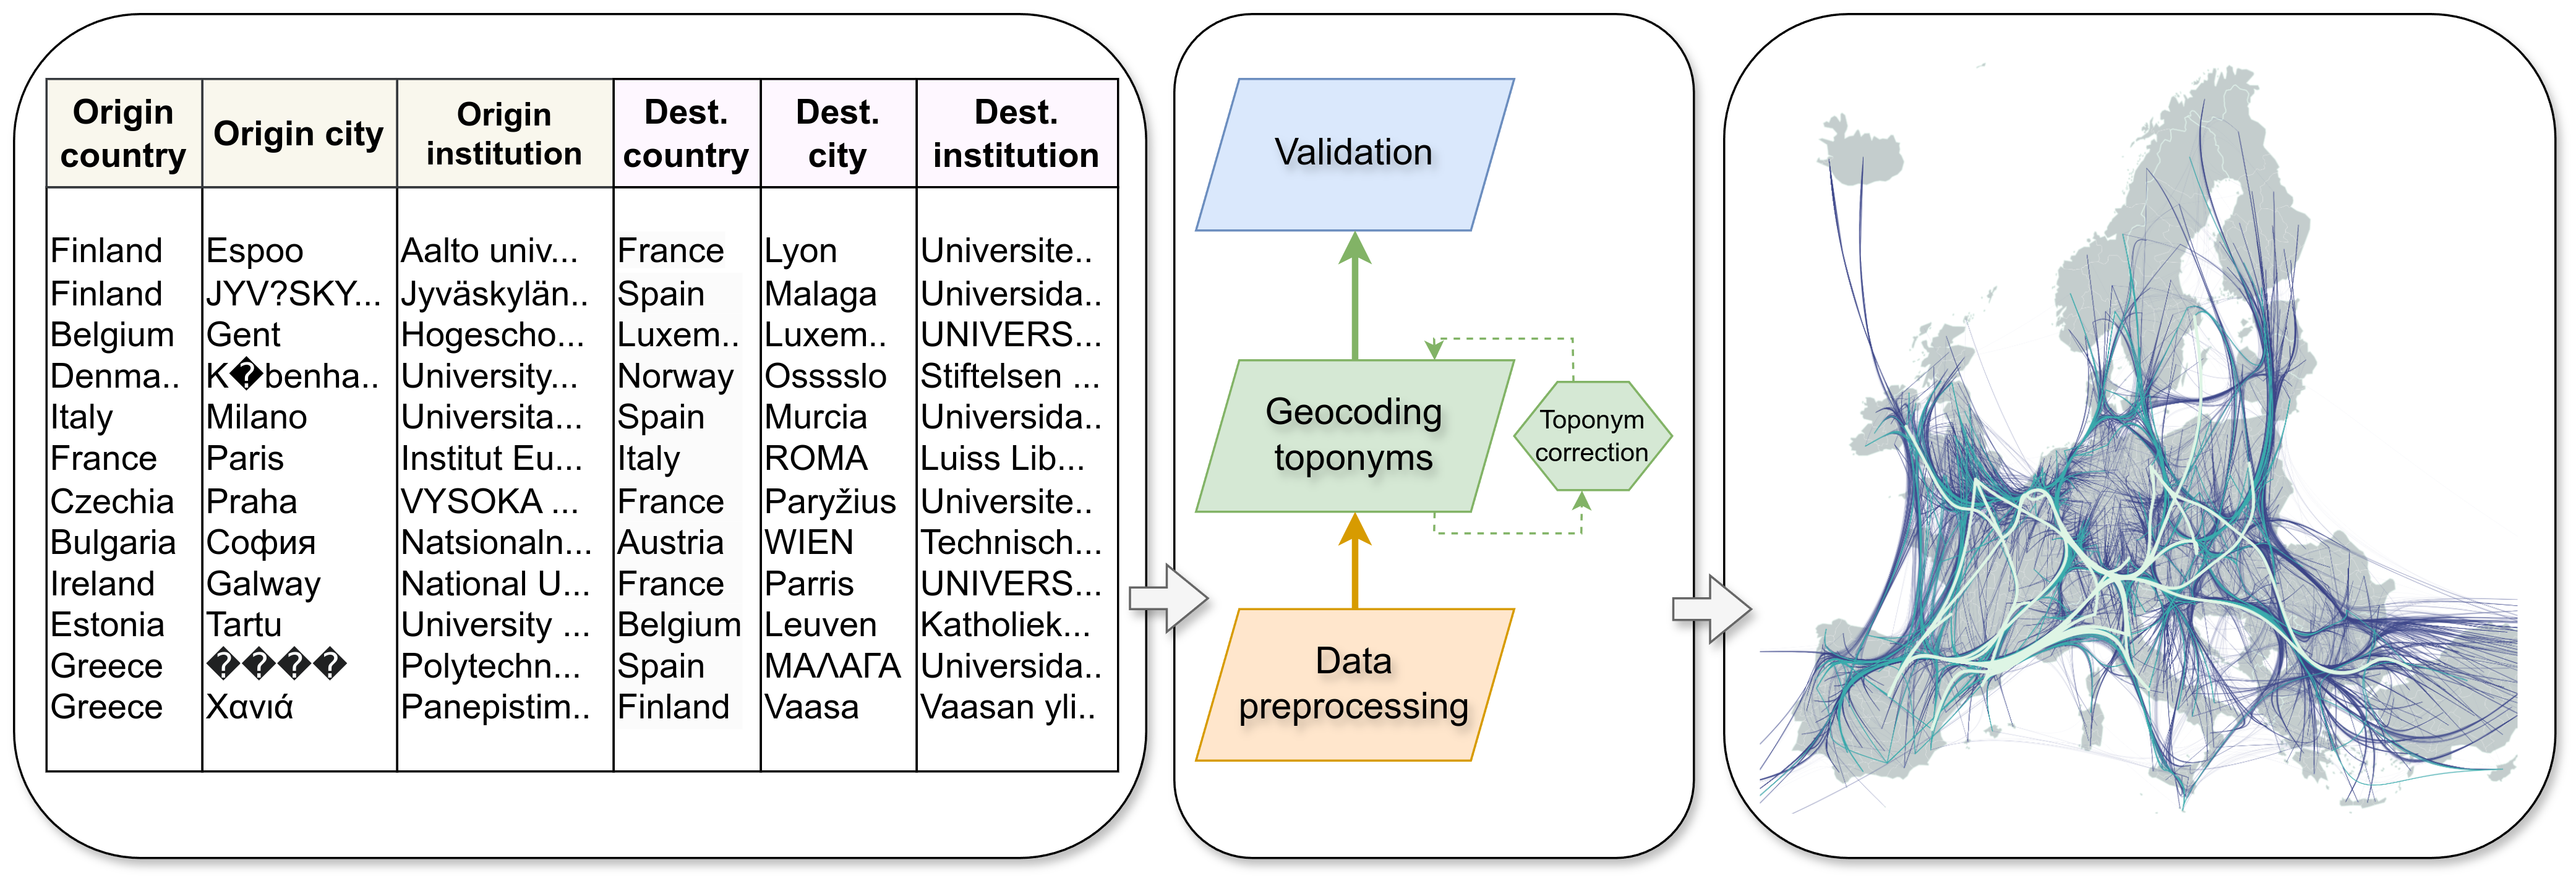
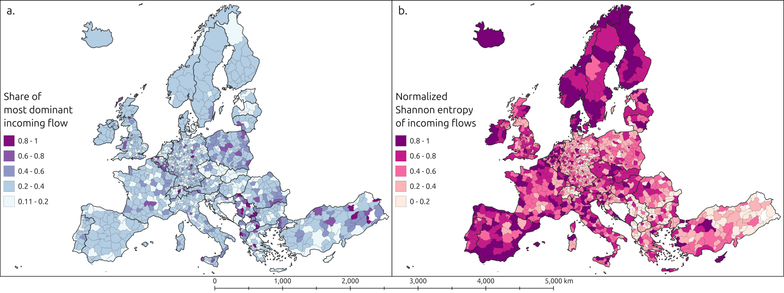
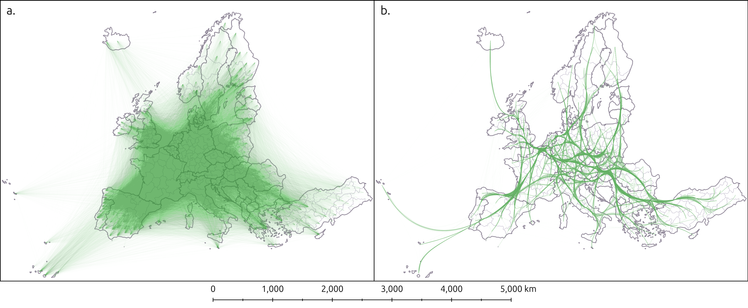
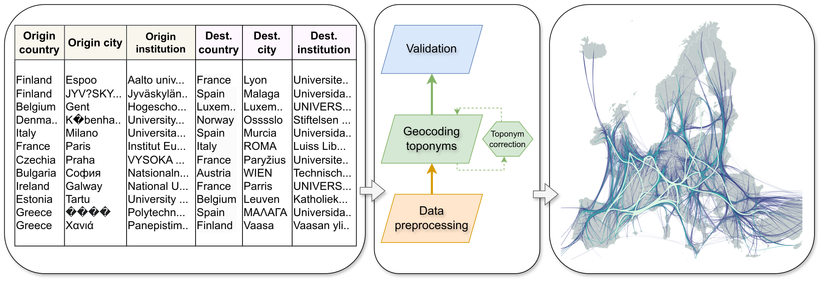
We geocoded the #mobility of over 2 million #Erasmus students across #Europe from 2014 to 2022 with @miladmzdh Oula Inkeröinen & Olle Järv. The data descriptor article is published in #ScientificData, and is an output from the #MobiTwin project.
https://doi.org/10.1038/s41597-025-04789-0
#GIScience #Geospatial #GIS #MobiTwin #OpenData #OpenScience
📣 Great News!!! ...🚲...🚲...🚲...
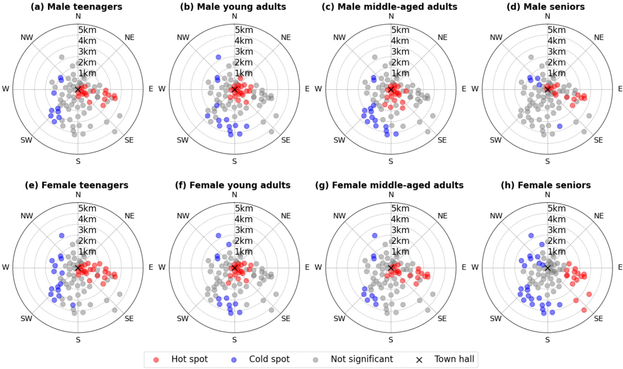
PhD researcher Xiao Cai has published a new article "Differences in bike-sharing usage and its associations with station-surrounding characteristics: A multi-group analysis using machine learning techniques”! 🎉
We congratulate on his Xiao on his excellent and exciting research! 💚 💚 💚
Learn more here: https://blogs.helsinki.fi/digital-geography/2025/03/25/new-paper-out-on-demographic-specific-factors-influencing-bike-sharing-usage/
Find the article here: https://doi.org/10.1016/j.jtrangeo.2025.104201