Moonvalley Releases Marey, an 'Ethical' AI Video Tool Built for Pro Filmmakers
It was trained on licensed data.

AI Firm Moonvalley Releases “Commercially Safe” Marey Video System To General Public
AI firm Moonvalley has released its Marey video model to the general public after an initial test run with filmmakers, agencies and other trial users.

This AI Video Generator Was Not Trained on Stolen Data
Marey is named after Étienne-Jules Marey, a 19th-century chronophotography pioneer.

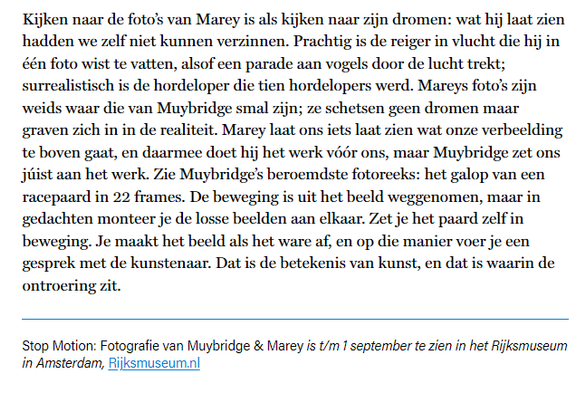
Het werk van Muybridge en Marey gaat niet alleen over fotografie
Eind negentiende eeuw ontdekten de fotografen Eadweard Muybridge en Étienne-Jules Marey hoe ze bewegingen konden vastleggen. Hun studies, nu te zien in het Rijksmuseum, vertellen iets over tijd zelf.
Het werk van Muybridge en Marey gaat niet alleen over fotografie
Eind negentiende eeuw ontdekten de fotografen Eadweard Muybridge en Étienne-Jules Marey hoe ze bewegingen konden vastleggen. Hun studies, nu te zien in het Rijksmuseum, vertellen iets over tijd zelf.

Visualising Sydney bus congestion with Marey charts - Jake Coppinger
As a side project I built Sydney Transit Graph - a visualisation of real-time Sydney bus congestion. Each line on the graph (a Marey chart) represents a bus completing its route (percentage) over time.
As a side project I built Sydney Transit Graph – a visualisation of real-time Sydney bus congestion. Each line on the graph (a Marey chart) represents a bus completing its route (percentage) over time.
It's open source on Github - let me know if you have any ideas for analysis or use!
https://jakecoppinger.com/2022/11/visualising-sydney-bus-congestion-with-marey-charts/
#sydney #tfnsw #sydneybuses #maps #urbanism #transit #publictransport #buses #marey #mareychart #graph
Visualising Sydney bus congestion with Marey charts - Jake Coppinger
As a side project I built Sydney Transit Graph - a visualisation of real-time Sydney bus congestion. Each line on the graph (a Marey chart) represents a bus completing its route (percentage) over time.