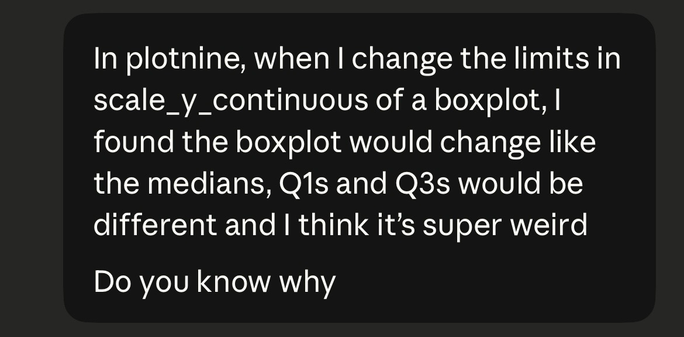
#statstab #516 Is there a boxplot variant for Poisson distributed data?
Thoughts: People like their canned visualisations, but you need to think what question you are answering.
#poisson #boxplot #sqrttransform #dataviz #r #outliers #distribution
#statstab #516 Is there a boxplot variant for Poisson distributed data?
Thoughts: People like their canned visualisations, but you need to think what question you are answering.
#poisson #boxplot #sqrttransform #dataviz #r #outliers #distribution
Boxplot, он же ящик с усами
Представьте, что вам нужно быстро сравнить распределения зарплат сотрудников разных отделов или оценить разброс результатов эксперимента. В таких ситуациях отличным выбором будет boxplot, он же “ящик с усами” – эффективный инструмент для выявления ключевых характеристик распределения, позволяющий быстро оценить медиану, разброс данных и обнаружить выбросы. В этой статье мы подробно разберем, что такое boxplot и почему его называют “ящиком с усами”.
https://habr.com/ru/articles/879840/
#python #анализ_данных #data_analysis #визуализация_данных #data_visualization #boxplot #ящик_с_усами #machine_learning #машинное_обучение #статистика
I had my first ever malware/adware incident on Mac OS X this morning (though I’ve only been using OS X since Jaguar—version 10.2, from 2002). (Well, first ever that I know about, obvs.)
It was quite tricky/tricksy, so I wrote it up, with some disgressions about box plots (‘cos, honestly, who doesn’t love a good box plot?)
https://www.tdda.info/an-adware-malware-story-featuring-safari-notification-centre-and-box-plots
If you use a Mac, you might find this useful.

This is not, primarily, an article about TDDA, but I thought it was worth publishing here anyway. Itʼs a story about a kind of adware/malware incident I had this morning—with digressions about box plots. Disgression I was doing some research for a book (on TDDA), looking up information …
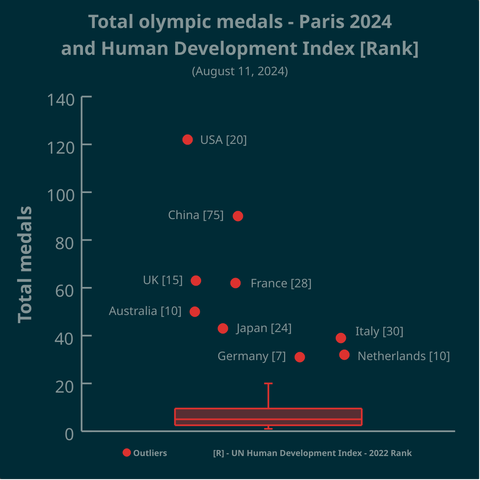
▶️ Total olympic medals won in Paris 2024 and Human Development Index 🏅
➡️ https://www.businesstimes.com.sg/opinion-features/what-olympic-medal-table-really-tells-us
After reading the article we made this #boxplot using #LabPlot, an open source data analysis and visualization software.
The plot doesn't provide answers, it rather invites some thinking.
#Olympics #Olympics2024 #France #China #USA #UnitedStates #UnitedKingdom #UK #Brazil #Australia #Japan #Italy #Canada #Germany #Italy #Netherlands #DataAnalysis #DataScience #OpenSource #FOSS
📣 week 8 of dataviz with R
💐Iris: length of sepals by species 💐
Testing the new version of ggplot v3.5.0 (gradients and ignoring scales with I() function)
📊{ggplot2}
Code available: https://t.ly/qeOj5
#rstats #dataviz #week8 #datavizweek8 #ggplot2 #iris #boxplot

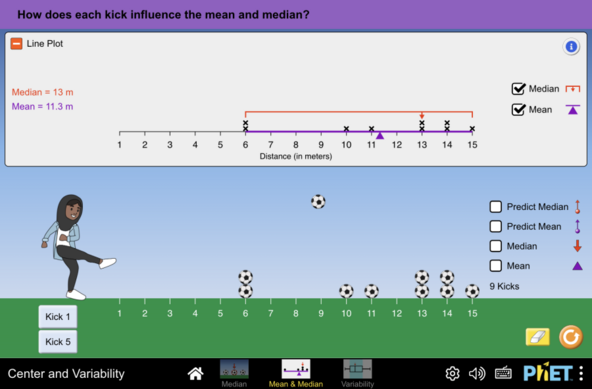
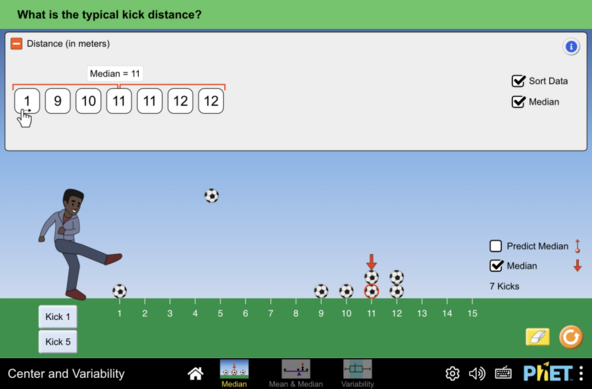
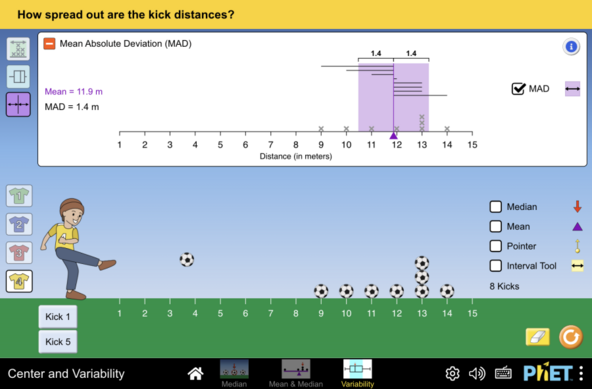
🚨👋⚽️ You will love our new sim, Center and Variability.
The sim allows students to explore mean, median, range, interquartile range and the median absolute deviation by interacting with a small dataset of distanced kicked.
Check it out, be sure to share!
https://phet.colorado.edu/sims/html/center-and-variability/latest/center-and-variability_all.html
Can you predict the shape of a distribution where the mean and median are equal?😄😉👍
#Median #Mean #centralTendency #Boxplot