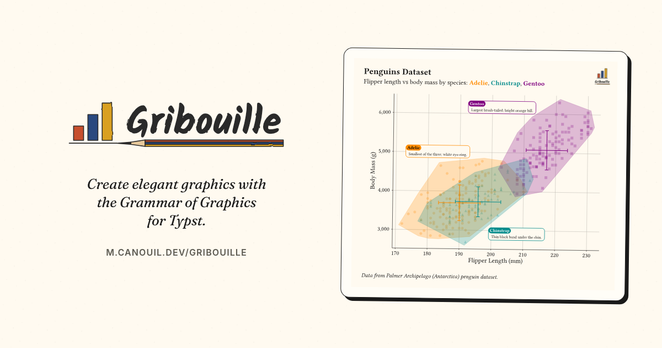
Warm recommendations for #plotnine for #python visualisation: it's feels a bit like emacs in that it takes time to grok its mental model, certainly if, like me you have no previous experience with its ancestor ggplot. But in the end it just does the job.

I was going to sit down and learn the {plotnine} python library today, but turns out there's nothing really to learnβ€”it's literally {ggplot2} code wrapped in parentheses. If you know {ggplot2} in R, turns out you also know how to make plots on Python!

#Rstats #plotnine #Python

The recording of my PyData Global talk about data visualisation with Plotnine in #Python is now available! 🐍

Give it a watch if you're interested in:

πŸ“Š customising plotnine plots
πŸ“ˆ combining with matplotlib functions
✍️ adding custom annotations with HighlightText

(or if you're an #RStats user wondering about Plotnine vs #ggplot2)

Link: https://www.youtube.com/watch?v=NBGJuaBF2rc

#DataViz #Plotnine

Nicola Rennie - Practical Techniques for Polished Visuals with Plotnine | PyData Global 2024

YouTube

Did you know you can now access #TidyTuesday data in #Python as well as #RStats?

Here's a plot of this week's data about Pixar films made with Plotnine! πŸ“Š

πŸ’» Import data using PyDyTuesday
🎨 Coloured subtitle text added with highlight_text
πŸ–ŠοΈ Fonts installed with pyfonts by Joseph Barbier

Code: https://github.com/nrennie/tidytuesday/tree/main/2025/2025-03-11

#DataViz #ggplot2 #plotnine #PydyTuesday

tidytuesday/2025/2025-03-11 at main Β· nrennie/tidytuesday

This repository contains the R and Python code used to produce my visualisations for the #TidyTuesday challenges. - nrennie/tidytuesday

GitHub

Gan nad ydwy'n gwneud cyfrifiadau ystadegol cymhleth rhagor, y prif reswm ro'n i'n dal i ddefnyddio R oedd i ddelweddu data gyda ggplot2. Ond rwy newydd ddarganfod plotnine ar gyfer Python, sy'n gweithio'n arbennig o dda, felly'n annhebygol o fynd yn Γ΄l i R!

#R #Python #ggplot2 #plotnine

PyData Global starts today! This evening I'll be talking about customising charts with Plotnine, and building better data visualisations πŸ“Š

πŸ“… Tue 3 Dec 2024
⏰ 18:30 UTC (13:30 EST)

#PyData #Plotnine #Python #DataViz

I'm super excited to be speaking at PyData Global in December! I'll be talking about:

πŸ“Š customising plotnine plots
πŸ“ˆ combining with matplotlib functions
✍️ adding custom annotations with HighlightText

I'll be using this chart πŸ‘‡πŸ‘‡πŸ‘‡ as an example!

Link: https://buff.ly/3Z9R9k6

#DataViz #Plotnine #Python #PyData #ggplot2

Practical Techniques for Polished Visuals with Plotnine PyData Global 2024

Plotnine is a data visualisation library that brings the Grammar of Graphics to Python, enabling users to build complex plots layer by layer. No background knowledge of plotnine is required, and the talk will begin with a brief introduction to the syntax of plotnine. The remainder of this talk will guide attendees through the process of customising plots to take them from the basic, default settings to high quality, effective visuals. Using an area chart displaying time series data as an example, this talk will focus on techniques for customising and annotating plots to highlight important insights. It will also show you how to exploit the fact that plotnine is built on top of matplotlib - enabling the use of a much wider range of libraries! This talk is designed to help data scientists and analysts improve their data storytelling skills by making their charts not only informative but visually engaging.

2441 runestones in Sweden.
#pydata #python #plotnine #dataviz
Trying out #plotnine and loving it so far! I guess being used to #ggplot2 helps.
#pydata #datavisualization
#plotnine enables me to plot in #python at a similar speed I can plot in #rstats. Love the #ggplot syntax!