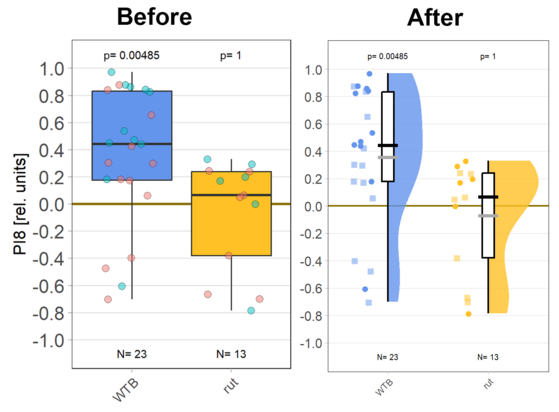
just saw a nice presentation by @Birdbassador at #EuroVis2023 on the design space of #RaincloudPlots.

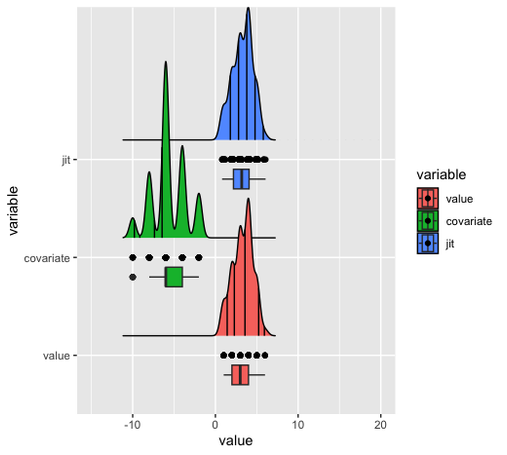
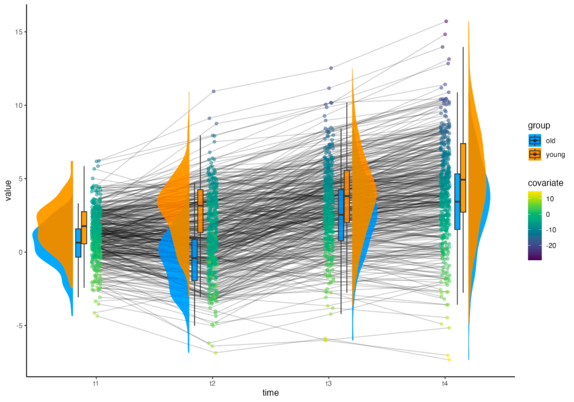
this @observablehq notebook shows several combinations of cloud, rain, and lightning to accommodate the distribution's shape, raw data values, and some statistics

⛈️ https://observablehq.com/@mcorrell/raincloud-robustness
📄 https://diglib.eg.org/handle/10.1111/cgf14826

#datavis #design

Raincloud Robustness

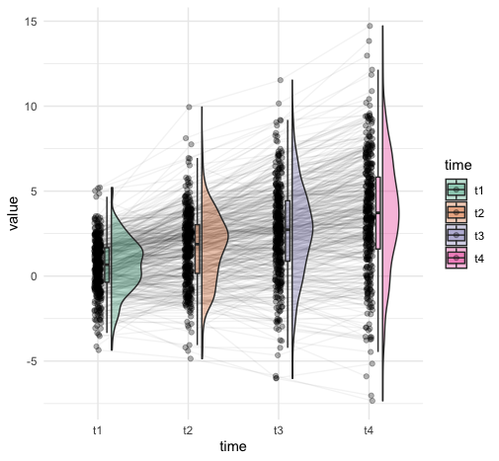
Explanation This notebook contains code associated with a paper to appear at EuroVis 2023, "Teru Teru Bōzu: Defensive Raincloud Plots". For reproducibility, there is a seed number. If you keep this seed number the same, the results relying on randomness should be identical to the paper on page load (although note that rerunning a cell will generate new values). A raincloud plot is a class of designs for visualizing distributions. Rainclouds combine visualizations of the overall shape of the distribution, th

Observable
I just love #raincloudplots! Thanks for the R-package!!

Very exciting news!

Our newest #rstats #package 📦 {ggrain} - a #ggplot2 extension package for Raincloud Plots in R - has been accepted at CRAN!

Now you can create Raincloud Plots within a simple 'geom_rain()' call, all according to the Grammar of Graphics!

Work together with:
@njudd
@rogierK

All the links:

- #CRAN version: https://cran.r-project.org/web/packages/ggrain/index.html

- #GitHub version: https://github.com/njudd/ggrain

- NWO Open Science Fund 2021: https://www.nwo.nl/en/projects/203001011

#data #openscience @Posit #raincloudplots

ggrain: A Rainclouds Geom for 'ggplot2'

The 'geom_rain()' function adds different geoms together using 'ggplot2' to create raincloud plots.

As part of our Open Science Fund, we will host our fourth (&last) FREE Raincloudplots virtual workshop - Sign up and join us to learn how to make rainclouds in R and Python!
When: 17 Feb 2023, 14:00-16:00 CET
Sign-up: https://github.com/jorvlan/raincloudplots-workshops
Funded by: #NWO #OpenScienceFund (edited) #rstats #datascience #dataisbeautiful #raincloudplots @jordyvanlangen
GitHub - jorvlan/raincloudplots-workshops: raincloudplots workshops

raincloudplots workshops. Contribute to jorvlan/raincloudplots-workshops development by creating an account on GitHub.

GitHub

#rstats help needed!

Using #ggridges you can also color by quantile (see 1st Figure).

Our question:

How to color - no quantile - by self-defined borders?
(e.g., for LIKERT data, 2nd figure!)

@dingemansemark

#openscience #opensciencefund #nwo #datascience #dataviz #opensource #rstats #datavisualization #ggplot2 #rpackage #raincloudplots #github #programming #CRAN #rstudio #posit #scicomm #science #academia #academics #visualization #teamscience #statistics

As part of our NWO funded Open Science project we are improving our #raincloudplots package - We have a new beta R package release, and would love feedback on whether it installs/loads ok, any bugs, clarity of the vignette etc. Do tell us the good, bad and ugly #datascience #rstats #openscience #datavis #dataisbeautiful https://github.com/njudd/ggrain
GitHub - njudd/ggrain: {package} Make beautiful Raincloud plots in R!

{package} Make beautiful Raincloud plots in R! Contribute to njudd/ggrain development by creating an account on GitHub.

GitHub
Having fun at our third #raincloudplots workshop - teaching people how to make it rain in #Rstats #python #matlab https://github.com/jorvlan/raincloudplots-workshops
GitHub - jorvlan/raincloudplots-workshops: raincloudplots workshops

raincloudplots workshops. Contribute to jorvlan/raincloudplots-workshops development by creating an account on GitHub.

GitHub