rogier kievit

@rogierK
786 Followers
408 Following
81 Posts
Prof Developmental Neuroscience at the Donders Institute/RadboudUMC. Brains, psychometrics, sourdough, running, science & Rstats. And sharks.

About a year ago, we embarked on a quest to answer one of the most intriguing questions:

If you flip a fair coin and catch it in hand, what's the probability it lands on the same side it started?

Today, we are finally ready to share the results. Thanks to my friends, collaborators, and even strangers from the internet, we collected flippin 350,757 coin flips. We ran several "Coin Tossing Marathons" (e.g., https://youtu.be/3xNg51mv-fk?si=o2E3hKa-ReXodOmc) and spent countless hours flipping coins.


Coin Tossing Marathon (4th of December 2022)

YouTube

1/thread
What is cognitive variability, you ask? It’s the ups and downs in performance for a specific individual, across seconds, hours, or even days and months. These ups and downs can have many reasons, from strategy exploration to fatigue, from expertise to diurnal effects. We all experience it, yet rarely study it in as much detail it deserves!

#psychology #cognition #bigdata #education #preprint #intelligence

Lifespan Cognitive Dynamics Lab: A lab retreat day away

Lifespan Cognitive Dynamics Lab
A highly competitive VIDI grant for my better half 🎉🎉 Keep your eyes open for exciting new work on the dynamics and mechanics of resilience https://www.universiteitleiden.nl/nieuws/2023/06/vidi-financiering-voor-acht-wetenschappers-universiteit-leiden
Vidi-financiering voor acht wetenschappers Universiteit Leiden

Acht wetenschappers van de Universiteit Leiden hebben een beurs toegekend gekregen van wetenschapsfinancier NWO. Met deze Vidi-financiering kunnen de onderzoekers de komende vijf jaar een vernieuwende onderzoekslijn opzetten en hun eigen onderzoeksgroep verder uitbouwen.

Universiteit Leiden
is there a best way to visualize collab networks for a subset of co-authors only? I'd want to supply a vector of gscholar id's and plot only collaborations within that sample. tools like https://github.com/pablobarbera/scholarnetwork seem to (only) plot everything #rstats #ggplot
GitHub - pablobarbera/scholarnetwork: Extract and Visualize Google Scholar Collaboration Networks

Extract and Visualize Google Scholar Collaboration Networks - GitHub - pablobarbera/scholarnetwork: Extract and Visualize Google Scholar Collaboration Networks

GitHub
Achievement unlocked! pandemic hobby still going strong #marathon

@PsychScience
journal #AMPPS will be publishing a paper on "Open Science in the Developing Countries" led by
@hcp4715. Here's a call for collaborators!

https://www.dropbox.com/s/z78917uwkd601rs/Open%20Science%20in%20Developing%20Countries_AMPPS.pdf?dl=0

Open Science in Developing Countries_AMPPS.pdf

Shared with Dropbox

Dropbox
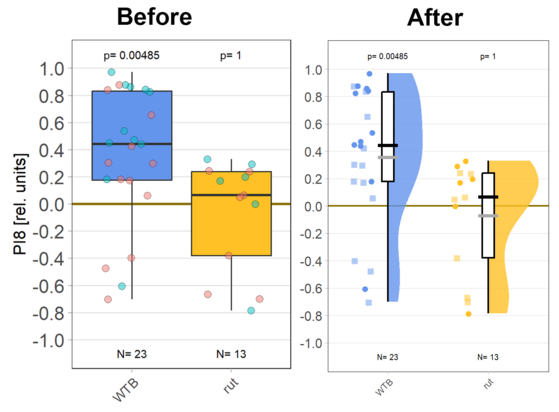
I just love #raincloudplots! Thanks for the R-package!!

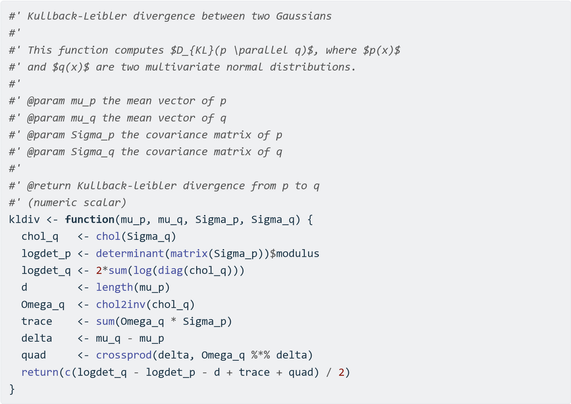
A few weeks ago, I wanted a light and efficient Kullback-Leibler divergence function for two multivariate normal distributions in #rstats  so I wrote up the process to get there: https://erikjanvankesteren.nl/blog/kldiv
It's more than 10 times as fast as the existing implementation I found and does not choke on high-dimensional (>250 dims) cases!

(there is a short speed comparison with #julialang  at the end!)

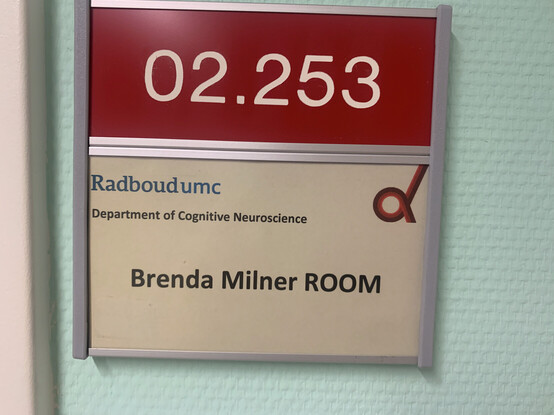
Updating the room names at the Donders Institute trigon building to honour more diverse pillars in the history of #neuroscience