OK matplotlib, I love you, but now you're just messing with me.
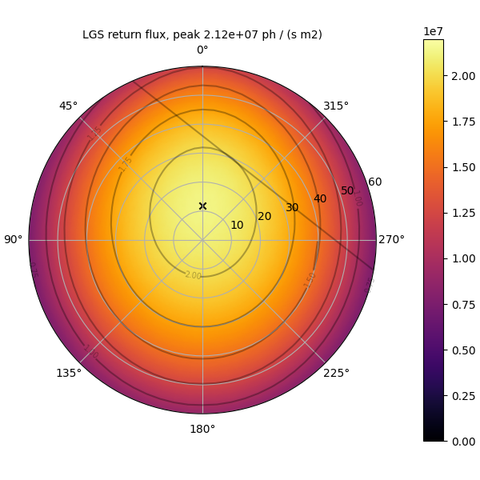
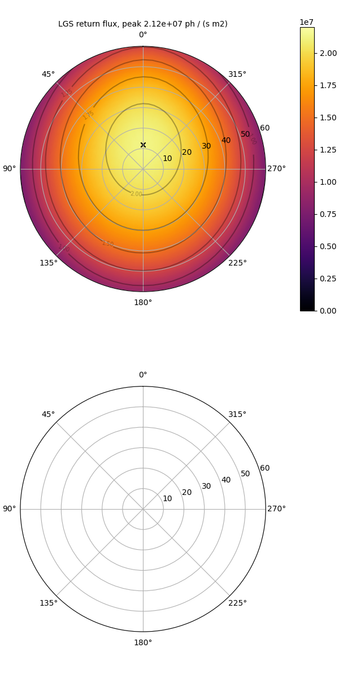
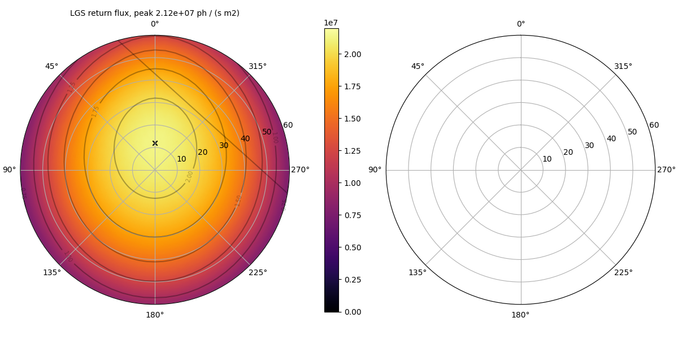
When I try to put contours on the polar plot of these data it works if, and only if, the plot is part of a multiplot with at least 2 rows of axes. If I try to plot it by itself, or in a multiplot with only one row, then the contour function draws a spurious line right through it. Nothing else is different, it's exactly the same plotting code running on the same data, the only thing that I changed is the number of axes in the call to subplots().
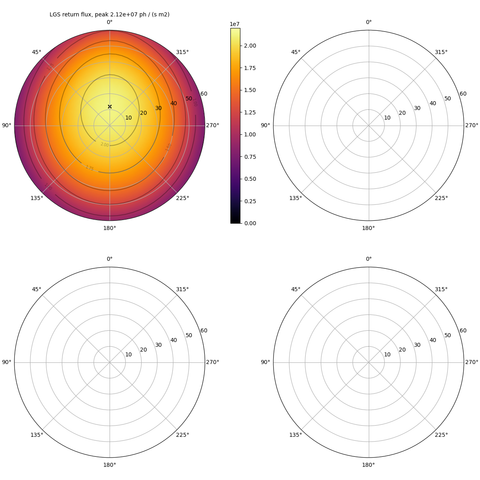
Welp, guess I'm plotting an extra axes and then editing it out of the resulting image.