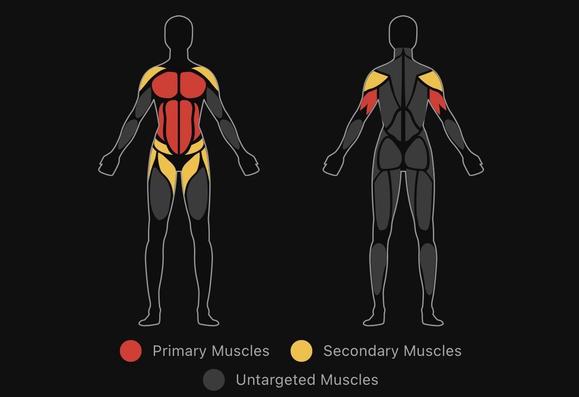
I am thinking to do a “heatmap” of the muscles of the human body using #matplotlib. The idea is to have strength workouts point at different muscles and show that dynamically using matplotlib (see image). Maybe nuts not sure yet…
I was thinking to convert the #png to #svg and then with svgpath2mpl parse it to a matplotlib path (not sure yet if I can do more than one path) :
https://petercbsmith.github.io/marker-tutorial.html
Now, is there a better/easier way?