In their most famous AMOC paper, the vanWesten team in Utrecht were not stingy with printer ink cartridges to illustrate their findings with maps and line charts, also in the Supplementary. https://onlinelibrary.wiley.com/doi/abs/10.1029/2025JC022651

The line charts in particular are of interest as they tell the story of the slow-ing AMOC during our lifetime.

Unfortunately, they're in annual means. So the really expected increased number of heat events (due to the atmosphere re-arranging itself around the #ColdBlob) are smoothed over by whatever the winters will be like.

What I read into it: during the slowdown, the extreme summer heat (that in my opinion kills the insects in Europe, and mammals and plants in large swathes of Southern Europe)
is balanced by extreme cold events in winter. That's why the lines are plateauing until the OFF state is reached in the emission-scenario RCP4.5 (I circled them).
A plateau – despite more extreme heat events happening – must mean a balance from the cold season.
A plateau in annual anomalies does not mean zero change.

I wrote more in the ALTtext.

Note: RCP4.5 without #AMOC collapse should produce local annual anomalies of about 6C over pre-industrial, more than double the global outcome of 2.5C.

Note also: the experiments included a return to no freshwater hosing. And that indeed undid the collapsing.

All is not lost. we CAN still act. But we must do that today, like. Not in 5 years. Today. That's how close it is.

#Climate #FossilFuels

AMOC?

More certain than previously thought https://www.science.org/doi/10.1126/sciadv.adx4298
And Guardian article https://www.theguardian.com/environment/2026/apr/15/critical-atlantic-current-significantly-more-likely-to-collapse-than-thought

Okay. Or not. But what does it mean, regionally, on the way to the OFF state?
Do we, us alive today experience any changes in our lifetime?

I would say yes.
Disclaimer: it's conjecture. and I am no expert in anything.

So. From tipping to OFF, it takes 100 to 150 years.
What happens during this slowdown phase?
I read in another paper that because AMOC slowdown intensifies the #ColdBlob, it also changes how the Lows and Highs over the Atlantic are distributed, which changes the jetstream, which in turn causes more extreme heat events in Europe.

More #ExtremeHeat events?
How do those affect our biosphere in Europe?
Well, I don't know exactly. But IPCC AR6 WG2 has mapped the impact on European plants, insects and mammals if we let global 3.2C become reality.
As you can see, 3.2C spells extinction level for European insects – due to heat events and related processes that come with 3.2C.

And I believe, a slow-ING #AMOC mimics heat events of such high-emission scenarios.
So we, us alive today, will watch our European insects AND soil…! die right in front of our eyes. I think.

Auch sichtbar: das Nachlassen des Golfstroms (🏌🏼‍♂️+ 🔌) verringert den Zufluß warmen Wassers in den Nordatlantik (vor unsere Haustür). In der Folge wird es bei uns kälter 🥶werden, während es global weiter wärmer 🥵 wird.

Was passiert, wenn warme feuchte Luftmassen auf die kalten Luftmassen hier in Europa treffen, kann sich wohl jeder selber ausmahlen. #Unwetter #Klimawandel #ColdBlob #Golfstrom #AMOC #Klimakipppunkt

https://bildungsserver.hamburg.de/themenschwerpunkte/klimawandel-und-klimafolgen/klimawandel/amoc-gegenwart-746948

I did something.
It's about the ColdBlob or SubPolarGyre or AMOC.
Specifically, about finding proxy locations on land for its annual evolution.

Taking SPG average sst in the months DJF and MAM, and computing also their year-on-year growth rate.

Then I computed the growth rate for DJF and MAM in all coordinates on land using Era5-Land 1951-2025.
And when the growthrate matches that of SPG within ±0.5 °C, it gets a ✅ .
6 ✅ per decade gets a 🔵 and counts toward selection.
Some more exclusion criteria applied, and I get a list of 315 locations on land for 🔵matching DJF growthrate, and a whopping additional 11,460 locations for MAM
In a 0.1x0.1 grid.

All DJF locations are in Papua. No proxies I know of have been recovered from Papua yet. I know all speleothems / stalagmites in caves🔴 , and all treerings ever analyzed🟢 , thanks to #NOAA .

But MAM °C has more locations. All of Indonesia basically is THE SPG in terms of growthrate. A few trees and speleothems match, one cave covers the whole #Holocene 🖖🏽
Large patches in Africa also match SPG in MAM. But only 2 short treering studies exist. No caves.
Middle and South America has plenty matching SPG MAM too, and a handful of trees and caves.

Yay.

#AMOC #climateChange #citizenscience #proxy #climateproxies #ColdBlob #SubPolarGyre
#Speleothem #treerings


Each year between January and April, a blob of cold water rises from the depths of the #GulfOfPanama to the surface, playing an essential role in supporting #marine life in the region. But this year, it never arrived.

When the #tradeWinds reach the Gulf of Panama they push hot surface water away from the coast, which makes room for cold water to rise from the deep.

#upwelling #coldBlob
https://www.nytimes.com/2025/09/12/climate/pacific-cold-water-upwelling.html
An Annual Blast of Pacific Cold Water Did Not Occur, Alarming Scientists

The cold water upwell, which is vital to marine life, did not materialize for the first time on record. Researchers are trying to figure out why.

The New York Times

#FYI #StefanRahmstorf #PotsdamInstitute #Atlantic #AMOC #ColdBlob #Greenland

"The northern Atlantic is the only region of the world which has defied global warming and has been cooling. What is going on there? What does the latest science say?
Talk at Utrecht University on 5 August 2025."

https://www.youtube.com/watch?v=sy2kBPujc4w

#climate #ClimateScience #climatechange #ClimateEmergency #ClimateCrisis #ClimateBreakdown #climatecatastrophe #ClimateDisruption #globalWarming #globalHeating #ExtremeWeather

Stefan Rahmstorf: The northern Atlantic 'cold blob'

YouTube

@DoomsdaysCW @hanscees @rahmstorf

Yeah. But first the heatwaves. 19°C and muggy at 6.30am here on 54°N in Germany.

The North Atlantic #ocean is back to "normal" global heating https://climatereanalyzer.org/clim/sst_daily/?dm_id=natlan

simply because ...the #ColdBlob reappeared, indicator of a slowing #AMOC and heralding #heatwaves with deaths & crop loss in Europe
https://climatereanalyzer.org/clim/daily_maps/?dm_id=world-wt&wm_id=t2anom&year=2025

To laugh, to weep, to scream?

Climate Reanalyzer

Sea surface temperature (SST) data visualizations

More on Bananas from North Atlantic in 2023, here by #MattEngland, Stefan #Rahmstorf et al
https://www.nature.com/articles/s41586-025-08903-5

They also wrote prose on the Conversation https://theconversation.com/unprecedented-heat-in-the-north-atlantic-ocean-kickstarted-europes-hellish-2023-summer-now-we-know-what-caused-it-258061

Low surface wind speed led to shallower-than-normal ocean mixing which enabled heating the surface more.
Less clouds from shipping SO2 were only marginally responsible and only in small pockets.

Okay. But where did the wind go?
Surface wind is impacted by jetstream. And I think, the jetstream got diverted in June and July 2023 to Northern Greenland. Due to low spring snow cover in Eastern Canada which led to dry soil – which in turn gets hotter than wet soil.
And according to
"Summer atmospheric circulation over Greenland in response to Arctic amplification and diminished spring snow cover over Canada" by
Preece et al 2023
https://www.nature.com/articles/s41467-023-39466-6
that hot soil in Eastern Canada leads to a High over Greenland – and a low over the #ColdBlob
East Canada was ablaze in June July 2023 suggesting dry and hence hot soil =perfect conditions for a North Greenland High, diverting the jetstream.

#climatechange #ocean #Atlantic #Canada #CanadaFires #jetstream #Arctic #ArcticAmplification

edit: added another image.
https://aslopubs.onlinelibrary.wiley.com/doi/full/10.1002/lol2.10455

Amazing!
And #openaccess °
Also, the references in the paper are a treasure trove.

20,000 days in the life of a clam shell 10 mio years ago in the Indonesian Throughway shows heavy rain events, seasons and what the authors say is a proto- #ENSO cyclicality, dominated by #LaNina .
https://www.sciencedirect.com/science/article/pii/S0031018224007004

When you hear "dominated by La Nina", is your mind jumping to AMOC slowdown and tipping? Mine does.

The longterm climate records stored in this clam species can indeed show early warning signals for AMOC's tipping behaviour. In this paper, Arellano-Nava and D.J. Reynolds et al 2024 look at up to 500 year old (!) clams from the Northern Atlantic, document the approach for finding Early Warning Signals, and see a slowdown since 1750 https://aslopubs.onlinelibrary.wiley.com/doi/full/10.1002/lol2.10455

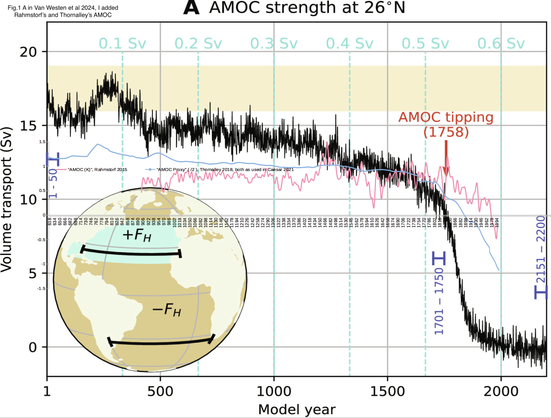
Light slowdown since 1750 was already visible in Thornalley's #AMOC reconstruction from 2018. He used sortable silt grain sizes near Iceland and near the Canadian coast .
So a different proxy showing the same slowdown.
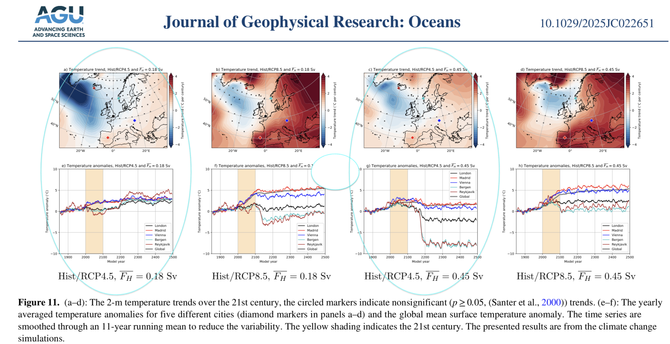
I took the liberty to superimpose Thornalley's and also Rahmstorf's AMOC reconstruction over vanWesten's AMOC in their freshwater experiment to show the striking similarity, see picture 3.

But a gradual, even slowdown isn't an actual Early Warning Signal for tipping behaviour where
"...it flickers, then it tips...".

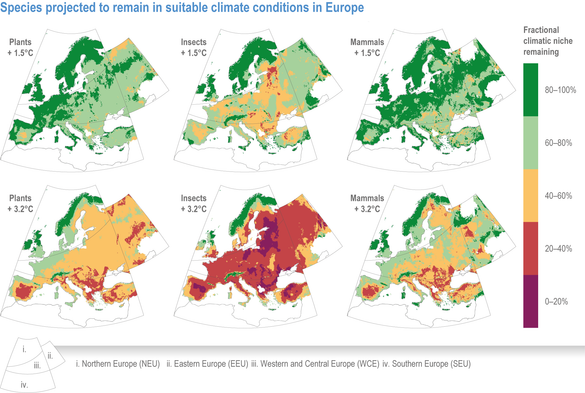
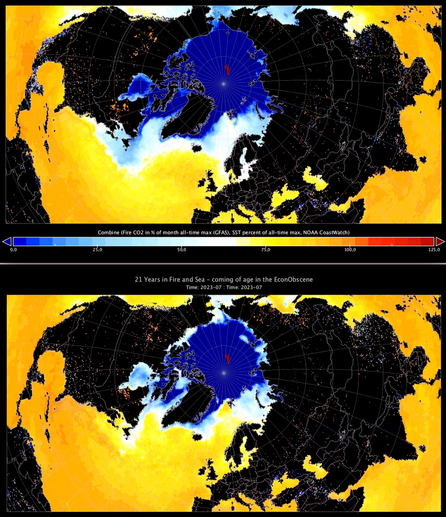
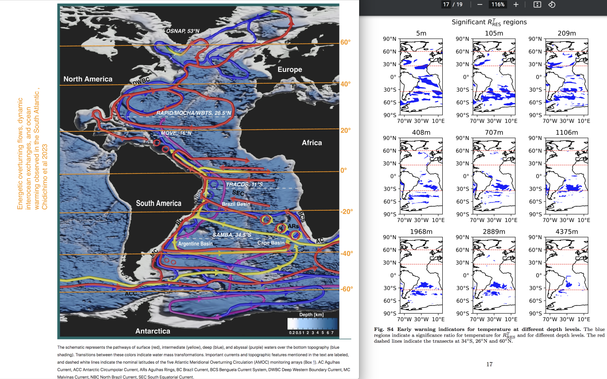
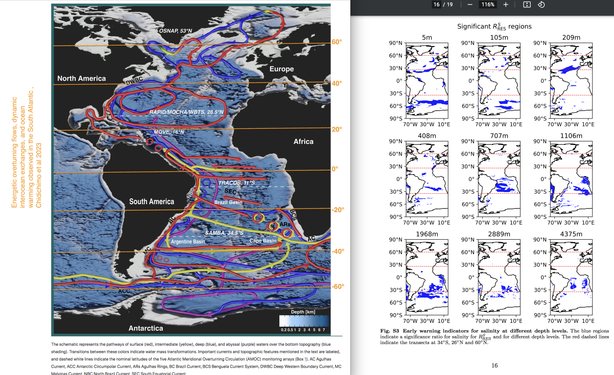
For AMOC's tipping behaviour, van Westen's team last year identified various Atlantic locations in various depths, none are in the classical research locations in the Northern North Atlantic ! Particularly not in the #ColdBlob... See the two map images from the supplement with the AMOC schematic by Chidichimo et al 2023.
It's still only a preprint tho, first author Emma Smolders https://arxiv.org/pdf/2406.11738

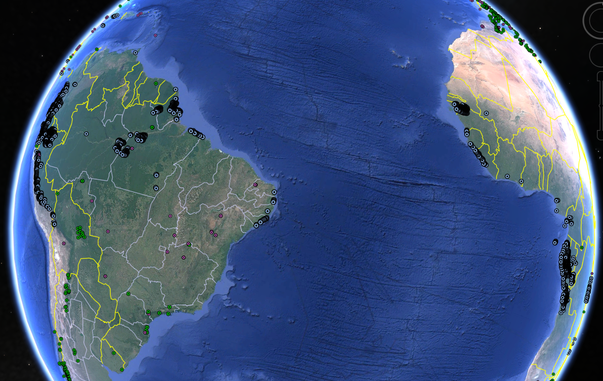
If I understand it correctly, the clam species lives on continental shelves in shallow-ish waters, not in the ocean abyss. So most locations Smolders et al identified are probably not good for using clams in reconstructing AMOC during the late #Holocene or in #paleoclimate. But some are, eg around the Canary Islands near Africa on 30°N, and many on the shelf along South America.
Especially important because the monitoring arrays (dashed lines in Chidichimo's schematic) have only been installed very recently. But clams can provide a continuous, annual to daily climate record everywhere – in shallow-ish waters.

I'm feeling actual excitement in the hope that researchers are now combing the ocean floor for these shells in the identified locations...

Guter Podcast zum Cold Blob und AMOC https://www.ardaudiothek.de/episode/iq-wissenschaft-und-forschung/raetselhafte-kaelteblase-geraet-der-subpolarwirbel-aus-dem-takt/bayern-2/13795411/

Mit #Rahmstorf, eh klar, aber noch eine Forscherin ist dabei, die speziell Interessantes erzählt.

Hab wieder was dazu gelernt.
Zum Beispiel ziemlich am Anfang, zum Subpolaren Wirbel, wie der überhaupt entsteht.
Durch Wind!
Der treibt das warme Golfstromwasser auf der Höhe New Yorks nach Osten. Und dort gibt es dann irgendwo so eine Art Kreuzung, wo der Wind nach Norden oder weiter nach Osten geht.
Wenn er nach Norden geht, treibt er damit auch den Wirbel an.
Und dann weht er auch mal vo Ost nach West... im Winter wohl..

Im Filmchen sieht man die v-Wind Komponente in den Wintermonaten. V-Wind ist rot, wenn der Wind nach Norden weht. Und blau, wenn er nach Süden weht. Daten: https://climatereanalyzer.org/research_tools/monthly_maps/

Der Subpolar Gyre / Cold Blob ist auch nich immer an derselben Stelle, fest eingemauert oder so. Nee! Das wabert alles so fuzzy rum, mal mehr rechts und mal mehr links.
Und je nachdem ob mehr rechts oder mehr links, gibt es in Zentraleuropa starke Hitze.

Muss auch gucken, dass ich ein paper von ihr finde. Vll steht ja in der "Introduction" noch mehr Interessantes um Subpolar Gyre drin.

#AMOC #ColdBlob #SPG #SubpolarGyre

Podcast: Rätselhafte Kälteblase - Gerät der Subpolarwirbel aus dem Takt?

Der Subpolarwirbel im Nordatlantik hat großen Einfluss auf das Wetter. Durch den Klimawandel gerät er ins Stocken. Forscher haben bereits einen Zusammenhang mit Hitzewellen in Europa nachgewiesen. Es könnte noch schlimmer kommen - wenn er ganz stoppt und die Atlantische Meridionale Umwälzbewegung mit ihm. Ein Podcast von Roana Brogsitter. GesprächspartnerInnen: Dr. Marilena Oltmanns, Klimaphysikerin, National Oceanography Centre, Southampton https://noc.ac.uk/ Prof. Stefan Rahmstorf, Ozeanograf und Klimaforscher, Potsdam Institut für Klimafolgenforschung https://www.pik-potsdam.de/en Dr. Julian Krüger, Meteorologe, Max-Planck-Institut für Meteorologie https://mpimet.mpg.de/startseite Feedback? Anregungen? Schreibt uns: WhatsApp (https://wa.me/491746744240) oder [email protected].

ARD Audiothek