🚀 Wow, Spikelog: the revolutionary tech that turns the ancient art of counting into a line graph! 📉 Forget those pesky "full observability stacks"—just POST a number and watch the magic unfold! 🎩✨ Who knew data analytics could be reduced to 'paint-by-numbers' for developers?! 😂
https://spikelog.com #Spikelog #DataAnalytics #TechInnovation #LineGraph #DeveloperTools #HackerNews #ngated
Stats Video 9 APA-Formatted Line Graph in Excel

Stats Video 9 APA-Formatted Line Graph in Excel
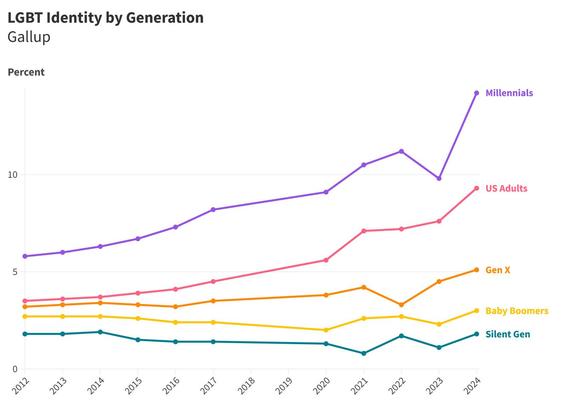
Now, let’s take a look at the graph with Gen Z removed, so we can more easily see the other lines.
25/x
#LGBT #US #USA #Graph #Chart #Infographic #LineGraph #Millennials #GenX
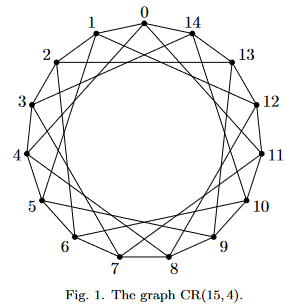
✍️Kochen-Specker sets in #four-dimensional #spaces #by Brandon Elford and Petr Lisonek
🔗10.26421/QIC24.13-14-5 (#arXiv:1905.09443)
#Kochen-Specker theorem
#linegraph
#orthogonalrepresentation
Line Graph in Power BI Visualization
shorts #linegraph #pbi Hello & Welcome to The B.I. Nerd Get Regular Updates about Business Intelligence Subscribe Now !!! source
https://quadexcel.com/wp/line-graph-in-power-bi-visualization/

@rysiek
🥥 Is it just me, or does it look like there's a #cat sitting in the middle of this #LineGraph of #Mastodon usage? 🥥
🥥 Is it just me, or does it look like there's a #cat sitting in the middle of this #LineGraph of #Mastodon usage? 🥥