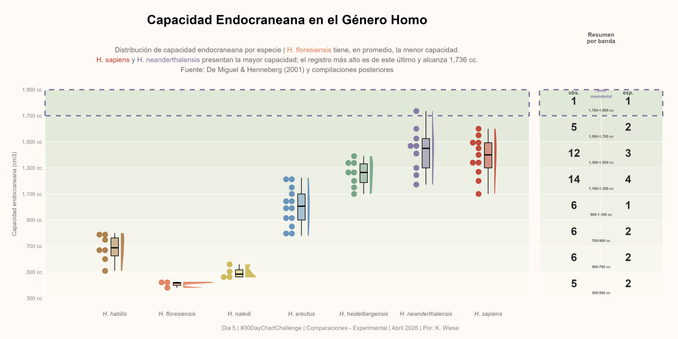
#Día5 | Comparaciones – Experimental | #30DayChartChallenge. Experimenté agregando una sumatoria horizontal de observaciones en un boxplot sobre la capacidad endocraneana en especies del género Homo. Creada usando R con #ggplot2, #ggdist, #dplyr, #scales, #ggtext, #patchwork, #tibble y #tidyr.

Linea de tiempo del Dataframe
#Timeline

#python #pandas #Rstats #Tibble #Polars

Where does humanity live? Mapped 30 years of global population shifts using #ggplot2! Custom coordinate transformation + {sf} + {terra} rasters = overlaid bar charts on world maps.
📉 Global North & Far East declining 📈 Tropics booming.
Full Code 🔗 https://tinyurl.com/pop-world-lat-lon
Made in #rstats with #sf, #tibble, #terra, #ggplot2 #DataViz
I've talked about creating data.frames and tibbles before, but it is an important topic so I have covered it again. This time specifically from the perspective of creating them from vectors. Post: www.spsanderson.com/steveondata/... #R #RStats #tibble #dplyr #tidyverse #dataframe #baseR #blog

New version 0.2.2 of  📦 distributions3 on #CRAN, together with @alexpghayes
#rstats

- Object-oriented computations on (vectors of) probability distributions

- More model-based probabilistic forecasts

- simulate() from fitted likelihood models

- Support in #tibble in addition to data.frame

Documentation at:

https://alexpghayes.github.io/distributions3/

Probability Distributions as S3 Objects

Tools to create and manipulate probability distributions using S3. Generics pdf(), cdf(), quantile(), and random() provide replacements for base R's d/p/q/r style functions. Functions and arguments have been named carefully to minimize confusion for students in intro stats courses. The documentation for each distribution contains detailed mathematical notes.

I have a #tibble containing groups of two observations each. I want to subtract one of the observations from the other. Pivoting to put each observation in its own column is my current approach, but it takes a long time. Any recommendations? #Rstats #tidyverse
Bombmakare gripen i Kungsängen
En man i 30-årsåldern som misstänks ha konstruerat flera av de bomber som använts i Stockholmsområrdet har gripits vid ett polistillslag på Hallonvägen i Tibble, Kungsängen, Upplands-Bro, utanför Stockholm. Polisen kom mannen på spåren när de utredde de olika sprängningar som ägt rum i Stockholm sen julhelgen.
https://blog.zaramis.se/2023/01/31/bombmakare-gripen-i-kungsangen/
#Brott #Stockholm #Upplands-Bro #Våld #Bomber #Bombmakare #Kungsängen #Tibble
Bombmakare gripen i Kungsängen | Svenssons Nyheter

En man i 30-årsåldern som misstänks ha konstruerat flera av de bomber som använts i Stockholmsområrdet har gripits vid ett polistillslag på Hallonvägen i

Svensson
RStats is being weird when I am trying to display a tibble. Fine when it's a Data.Frame, but not a tibble. See pic. Having played about with options(width=200). Could it be something {pillar} related? Any ideas? Thanks. #rstats #tidyverse #tibble #radian

Recently ran into a disturbing #ChatGPT result: I asked it to translate a #python function written by Mathieu Daëron (https://github.com/mdaeron/D47crunch) to #R, using the #tidyverse and a #tibble. I had done this manually for my #rpackage https://github.com/isoverse/clumpedr/ and wanted to see how they would compare.

It returned my code literally, including TODO notes, comments, and #roxygen skeleton. But it did not say where it got the code from, even when pressed. My R package is on #github under #GPL 3. Thoughts?

GitHub - mdaeron/D47crunch: Python library for processing and standardizing carbonate clumped-isotope analyses, from low-level data out of a dual-inlet mass spectrometer to final, “absolute” Δ47 and Δ48 values with fully propagated analytical error estimates.

Python library for processing and standardizing carbonate clumped-isotope analyses, from low-level data out of a dual-inlet mass spectrometer to final, “absolute” Δ47 and Δ48 values with fully prop...

GitHub

Every time I work with data.table I think what a great package. The speed alone is great. What I also like is the tibble-like behavior when displaying data.

#tibble #datatable #rstats