21 Best Free and Open Source Python Visualization Packages
https://fed.brid.gy/r/https://www.linuxlinks.com/best-free-python-visualization-packages/

21 Best Free and Open Source Python Visualization Packages
https://fed.brid.gy/r/https://www.linuxlinks.com/best-free-python-visualization-packages/
Today I learned how to make a custom project template with the python cookiecutter tool
https://www.cookiecutter.io/
At my work we do a scientific validation project whenever we change our data analysis pipeline. So a lot is the same, but we need to be able to customize the validation depending on what changed in our pipeline. The templates look like they will help us be consistent while allowing flexibility. I am excited about it!
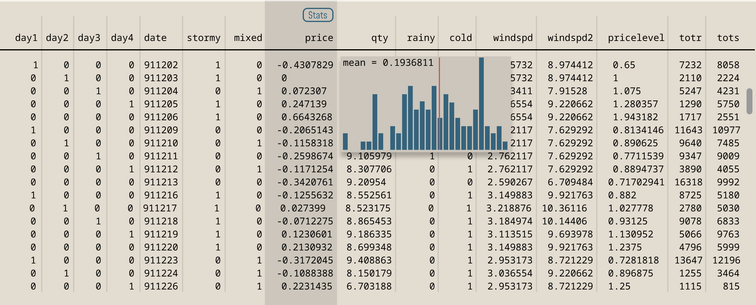
Exploratory data analysis is usually where the first real insight appears, and I’ve been looking for ways to make that moment clearer and more immediate.
One experiment I’m trying is a hover-based UI: move your cursor over a column and a compact histogram appears. It gives you an instant feel for the distribution without interrupting your flow.
#DataVisualization #ExploratoryDataAnalysis #UXDesign #InformationDesign #EdTech
#CodemotionMilan è la prossima settimana !
Ci sarò anche io con un talk su
🔍 #ExploratoryDataAnalysis
📊 #DataVisualization
mercoledì 1️⃣5️⃣ ottobre alle 🕧 12:30 Gate 5️⃣
Corley Cloud at CodemotionMilan
#EDA #GraphTools #Accessibility #Interpretability #BestPractices
Python cheat sheet how to summarize data #pythonforbegineers #dataanalysis #exploratorydataanalysis
FREE GUIDE: SUPPORT THE CHANNEL ... source
Data Literacy in Practice: Essential Skills for Analysis | CoListy
Gain key skills in data preparation, analysis, and visualization to effectively communicate findings. No complex math involved!
#freeonlinelearning #colisty #courselist #dataliteracy #dataanalysis #exploratorydataanalysis #datavisualization #datapreparation #datacommunication #dataskills #beginnerdatacourse #onlinelearning #datainsights.
https://colisty.netlify.app/courses/data-literacy-in-practice-essential-skills-for-analysis/
Exploratory Data Analysis||Step-by-Step|| in 15 Minutes
EDA #dataanalysis #AI #ML #datascience #machinelearning #artificialintelligence #exploratorydataanalysis Link to EDA ... source
https://quadexcel.com/wp/exploratory-data-analysisstep-by-step-in-15-minutes/
Just wrapped up an exhilarating dive into the IMDB Dataset! 📊🎥
Exploratory Data Analysis (EDA) of IMDB Dataset: https://therational.ist/about/projects/imdb-eda/
Did you know the record for most works adopted to movies belongs to William Shakespeare with 412 movies!
Or that, Game of Thrones is among 5 most loved titles while it's episode “The Iron Throne” is among 5 most hated!
#TIL there wasn't a wikipedia page for the datasaurus dozen that complements the Anscombe's quartet. that is, until today when i helped create it 🤘
#DataViz #DataVisualization #Data #DataScience #EDA #ExploratoryDataAnalysis
New blog post! Starting a look into data from the World Happiness Report by way of reviewing a couple of packages for exploratory data analysis. There is also a cat. Give it a read, let me know what you think. A deeper dive into the data coming soon.


