After around 2 years of work (on- and off), I've released I/O Riot NG 1.0.0! It is a full rewrite of my 2017 C/SystemTap tracer. I/O Riot NG uses BPF to capture syscalls and allows you to analyse them. #golang #bpf #ebpf #ior #ioriot #syscall #tracer #flamegraphs #flamegraph https://foo.zone/gemfeed/2026-05-08-unveiling-ior-ng-part-1.html

Got upset by the #phpunit testsuite "hanging" for 10s before executing even a single test involving our app. This has been like that for too long I said to myself.

Instead of blindly var_dump() -ing around I used #xdebug traces to find where the issue was.

A nice #flamegraph led me to the culprit: MySQL "truncate table" taking 80% of the time 🙈

Thanks @derickr for your work (and how-to videos)!

#php #symfony #debugging

How to use #flamegraphs for #performance #profiling

https://runbooks.gitlab.com/tutorials/how_to_use_flamegraphs_for_perf_profiling/

Off-CPU Analysis - by Brendan Gregg:
https://www.brendangregg.com/offcpuanalysis.html

- On-CPU: where threads are spending time running on-CPU
- Off-CPU: where time is spent waiting while blocked on I/O, locks, timers, paging/swapping, etc.

#Testing #Perf #DataViz #DataVisualization #Flamegraph

How to use flamegraphs for performance profiling

Runbooks
Morning ☕ with the #flamegraph 🔥 taken on #FreeBSD 15.0-STABLE
Mercredi 4 Juiln, nous aurons le plaisir de recevoir VictorGallet de @[email protected] pour nous parler Async Profiler: optimiser vos applications #flamegraph #optimization https://www.alpesjug.fr/?p=3566
Async Profiler: optimiser vos applications – Alpes JUG

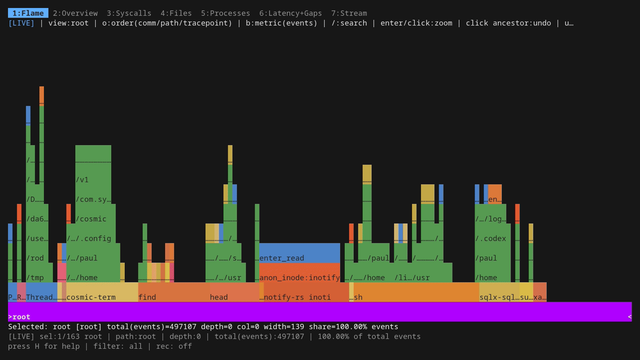
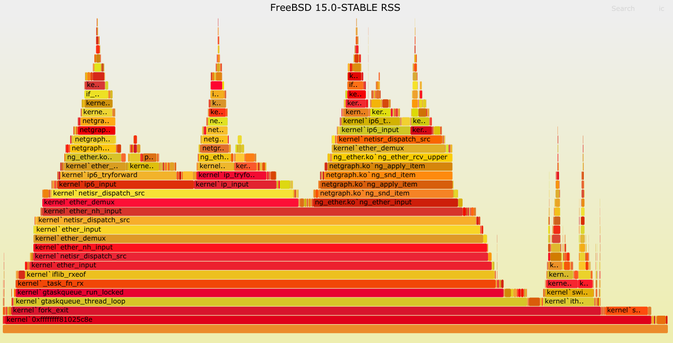
 I wanted to try 🔥 📈 flamegraph (perf) today, so I wrote a quick program to iterate over some "stuff" ™️ .

Then I wanted to see some function calls so I added more functionality.

Then I duplicated it to iterate over some other "stuff" ™️ .

Then I added some nice things to alter the output.

Then i thought, "ah I'll snap it".

⏲️ A 5 minute test turned into a few hours and now I have two nice programs which I've wanted for a while, and a Snap.

I do it to myself 🙄

🌐 Perf: https://github.com/torvalds/linux/blob/master/tools/perf
🌐 https://perfwiki.github.io/main/
🌐Flamegraph: https://github.com/flamegraph-rs/flamegraph?tab=readme-ov-file#flamegraphs-are-the-beginning-not-the-end

#Flamegraph #Perf #Linux #Snapcraft #Snap #Experiment #Programming #Rust #RabbitHoles #Ubuntu

linux/tools/perf at master · torvalds/linux

Linux kernel source tree. Contribute to torvalds/linux development by creating an account on GitHub.

GitHub

Inspecting flamegraphs is a pain - dealing with SVG files, opening a browser… ugh.

Not anymore!

🔎 **flamelens** — An interactive flamegraph viewer for the terminal.

🔥 Works with perf, py-spy and cargo-flamegraph.

🦀 Written in Rust & built with @ratatui_rs

⭐ GitHub: https://github.com/YS-L/flamelens

#rustlang #ratatui #tui #flamegraph #profiling #development #terminal #commandline

GitHub - YS-L/flamelens: Flamegraph viewer in the terminal

Flamegraph viewer in the terminal. Contribute to YS-L/flamelens development by creating an account on GitHub.

GitHub

Deep dive into YugabyteDB's PostgreSQL compatibility and its design, my FOSDEM talk recording is online:

Reusing the PostgreSQL codebase in a Distributed SQL Architecture

#executionplan #callstack #flamegraph #opensourcecode #internaltracing

https://fosdem.org/2025/schedule/event/fosdem-2025-5036-reusing-postgresql-codebase-in-a-distributed-sql-architecture-yugabytedb-/

FOSDEM 2025 - Reusing PostgreSQL codebase in a Distributed SQL Architecture (YugabyteDB)

Perforator: новая система непрерывного профилирования теперь в опенсорсе

Привет! Сегодня мы выложили в опенсорс Perforator — систему непрерывного профилирования (continuous profiling), которую используем внутри Яндекса для анализа производительности большинства сервисов. В Github-репозитории доступен исходный код системы и инфраструктура для развёртывания своей инсталляции Perforator на кластере Kubernetes. Кроме того, Perforator можно использовать на своём компьютере как более простую замену perf record: профили получаются точнее, а оверхед меньше. Исходный код доступен под лицензией MIT (и GPL для eBPF-программ) и запускается под x86-64 Linux. При помощи Perforator и прошлых подходов к задаче профилирования мы регулярно оптимизируем самые крупные сервисы в Яндексе, например Баннерную крутилку или Поиск, на десятки процентов. Кроме того, Perforator реализует недостающий в опенсорсе компонент профилирования для простой автоматической оптимизации программ с использованием profile-guided optimization. Наши тесты показывают, что использование PGO даёт ускорение около 10% в разных сценариях. Под катом поговорим про профилирование под Linux, опишем вызовы и сложности, возникающие при профилировании, изучим, как устроен Perforator внутри, и обсудим, как можно использовать полученную систему.

https://habr.com/ru/companies/yandex/articles/875070/

#профилирование #profiling #continuous_profiling #оптимизация #flamegraph #opensourse #опенсорс #опенсорс_яндекса

Perforator: новая система непрерывного профилирования теперь в опенсорсе

Привет! Сегодня мы выложили в опенсорс Perforator — систему непрерывного профилирования (continuous profiling), которую используем внутри Яндекса для анализа производительности...

Хабр
PyCharm 2024.3.2: uv Package Management Support and More! | The PyCharm Blog

Get uv package management support, flame graph visualization, and other improvements in PyCharm 2024.3.2.

The JetBrains Blog