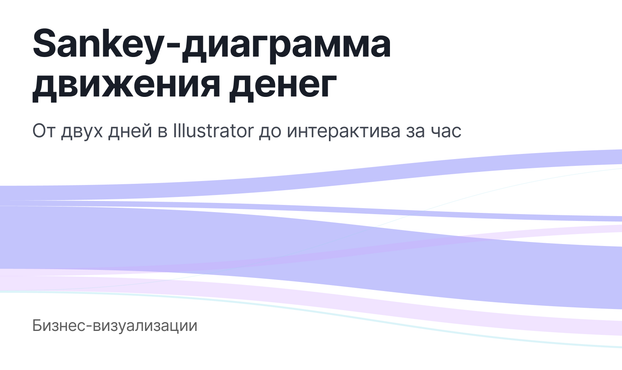
π¨ New at @civio
Some hot news about one of our (many) fights to improve institutional transparency: we've been trying to find out who the ministers' advisors are for over a year (and still waiting...). But that's enough. Weβre taking this to court.
ππ» The whole odyssey, with #dataviz included (in Spanish):
https://civio.es/poder/2025/05/20/la-larga-travesia-de-mas-de-un-ano-para-saber-quienes-son-los-asesores-de-los-ministros/
La DirecciΓ³n General de FunciΓ³n PΓΊblica, que tiene los datos, ignora al Consejo de Transparencia y se inventa un nuevo proceso para que respondan los ministerios: la mayorΓa de ellos oculta, como mΓnimo, algunos nombres .
This bundle includes three books: Visualising Data with JavaScript, Data Dashboards with JavaScript and Fundamentals of HTML, SVG, CSS and JavaScript for Data Visualisation. Fundamentals of HTML, SVG, CSS and JavaScript for Data Visualisation contains foundation material for the two other books. It's ideal if you're a programmer and need to get up to speed with HTML, SVG, CSS and JavaScript. Please note Visualising Data with JavaScript and Data Dashboards with JavaScript contain common chapters on Chart.js and Leaflet. Visualising Data with JavaScript also contains chapters on D3 and data stories. Data Dashboards with JavaScript also contains chapters on React and data dashboards.
Π‘ΠΎΠ·Π΄Π°Π½ΠΈΠ΅ ΠΈΠ½ΡΠ΅ΡΠ°ΠΊΡΠΈΠ²Π½ΡΡ ΠΊΠ°ΡΡ Ρ D3.js ΠΈ Leaflet: ΠΠΈΠ·ΡΠ°Π»ΠΈΠ·Π°ΡΠΈΡ ΠΎΠ±ΡΠ΅ΠΊΡΠΎΠ² ΠΈ Π³ΡΠ°ΡΠΎΠ²
ΠΠΎΠΌΠ±ΠΈΠ½Π°ΡΠΈΡ Π±ΠΈΠ±Π»ΠΈΠΎΡΠ΅ΠΊ D3.js ΠΈ Leaflet ΠΏΡΠ΅Π΄ΠΎΡΡΠ°Π²Π»ΡΠ΅Ρ ΠΌΠΎΡΠ½ΡΠΉ ΠΈΠ½ΡΡΡΡΠΌΠ΅Π½ΡΠ°ΡΠΈΠΉ Π΄Π»Ρ ΡΠΎΠ·Π΄Π°Π½ΠΈΡ ΠΈΠ½ΡΠ΅ΡΠ°ΠΊΡΠΈΠ²Π½ΡΡ Π³Π΅ΠΎΠ³ΡΠ°ΡΠΈΡΠ΅ΡΠΊΠΈΡ Π²ΠΈΠ·ΡΠ°Π»ΠΈΠ·Π°ΡΠΈΠΉ. Leaflet ΠΎΡΠ²Π΅ΡΠ°Π΅Ρ Π·Π° ΠΎΡΠΎΠ±ΡΠ°ΠΆΠ΅Π½ΠΈΠ΅ ΠΊΠ°ΡΡ ΠΈ ΡΠΏΡΠ°Π²Π»Π΅Π½ΠΈΠ΅ ΡΠ»ΠΎΡΠΌΠΈ, Π° D3.js ΠΏΠΎΠ·Π²ΠΎΠ»ΡΠ΅Ρ Π΄ΠΎΠ±Π°Π²Π»ΡΡΡ ΠΊΠ°ΡΡΠΎΠΌΠ½ΡΠ΅ ΡΠ»Π΅ΠΌΠ΅Π½ΡΡ, ΡΠ°ΠΊΠΈΠ΅ ΠΊΠ°ΠΊ ΠΌΠ°ΡΠΊΠ΅ΡΡ, Π»ΠΈΠ½ΠΈΠΈ ΠΈΠ»ΠΈ ΡΠ»ΠΎΠΆΠ½ΡΠ΅ Π³ΡΠ°ΡΡ.
https://habr.com/ru/articles/906414/
#javascript #leaflet #d3js #ΠΊΠ°ΡΡΠ° #Π³ΡΠ°ΡΡ #frontendΡΠ°Π·ΡΠ°Π±ΠΎΡΠΊΠ°
ΠΠΎΠΌΠ±ΠΈΠ½Π°ΡΠΈΡ Π±ΠΈΠ±Π»ΠΈΠΎΡΠ΅ΠΊ D3.js ΠΈ Leaflet ΠΏΡΠ΅Π΄ΠΎΡΡΠ°Π²Π»ΡΠ΅Ρ ΠΌΠΎΡΠ½ΡΠΉ ΠΈΠ½ΡΡΡΡΠΌΠ΅Π½ΡΠ°ΡΠΈΠΉ Π΄Π»Ρ ΡΠΎΠ·Π΄Π°Π½ΠΈΡ ΠΈΠ½ΡΠ΅ΡΠ°ΠΊΡΠΈΠ²Π½ΡΡ Π³Π΅ΠΎΠ³ΡΠ°ΡΠΈΡΠ΅ΡΠΊΠΈΡ Π²ΠΈΠ·ΡΠ°Π»ΠΈΠ·Π°ΡΠΈΠΉ. Leaflet ΠΎΡΠ²Π΅ΡΠ°Π΅Ρ Π·Π° ΠΎΡΠΎΠ±ΡΠ°ΠΆΠ΅Π½ΠΈΠ΅ ΠΊΠ°ΡΡ ΠΈ ΡΠΏΡΠ°Π²Π»Π΅Π½ΠΈΠ΅ ΡΠ»ΠΎΡΠΌΠΈ, Π° D3.js...
Γber Ostern die #Parteispenden im #Wahlkampf visualisiert.
tbh: Ein guter Vorwand sich mit D3js' general update pattern zu beschΓ€ftigen.
Hier sind die Rohdaten: https://www.bundestag.de/parlament/praesidium/parteienfinanzierung/fundstellen50000/2025/ & https://www.bundestag.de/parlament/praesidium/parteienfinanzierung/fundstellen50000/2024/
The data flow for the new project so far is as follows:
Maintain the data collection in Strapi - all news clippings, people, org info etc are kept in the CMS
@astro pulls Strapi data as a collection and builds static JSON files as ReST routes
#Svelte + #d3js pull the data from the ReST endpoints and draw the visualization in the browser.
The actual site is fully static, but I get the benefit of a full db and a nice interface for the backend, that is hosted independently.
"D3 (or D3.js) is a free, open-source JavaScript library for visualizing data. Its low-level approach built on web standards offers unparalleled flexibility in authoring dynamic, data-driven graphics."
#HatTip to @AdeptVeritatis who noticed that's what WeedTree is using for its visualisation.
Learn how to build animated maps with D3.js and Svelte! πβ¨
π Perfect for data journalists, data nerds, and curious devs.
Link below! π