I recently discovered the tidyplots package in R, and it’s impressive how effortlessly it enables you to create beautiful, publication-ready plots.

The example visualizations shown here were created by the package author, Jan Broder Engler, and are featured on the tidyplots website: https://jbengler.github.io/tidyplots/

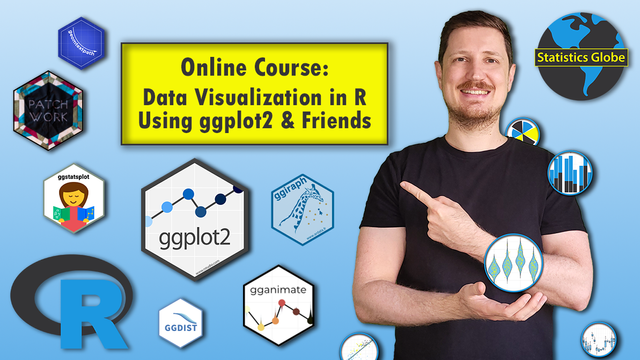
Click this link for detailed information: https://statisticsglobe.com/online-course-data-visualization-ggplot2-r

#statisticsclass #datavisualization #advancedanalytics #rprogramminglanguage #visualanalytics #package #tidyverse


If you're a Stata user, you should switch to R now!

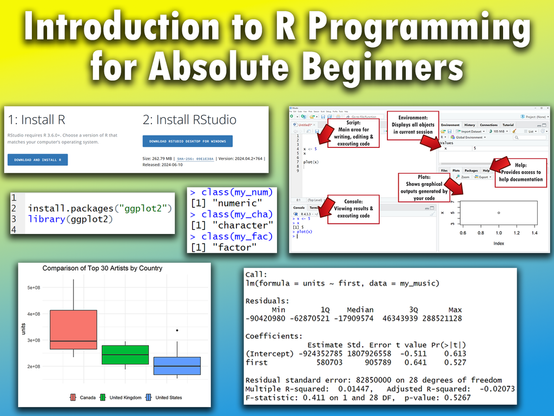
Thinking about switching to R? Check out my online course for absolute beginners in R programming.

Click this link for detailed information: https://statisticsglobe.com/online-course-r-introduction

#advancedanalytics #data #package #datasciencecourse #statisticsclass #rprogramminglanguage

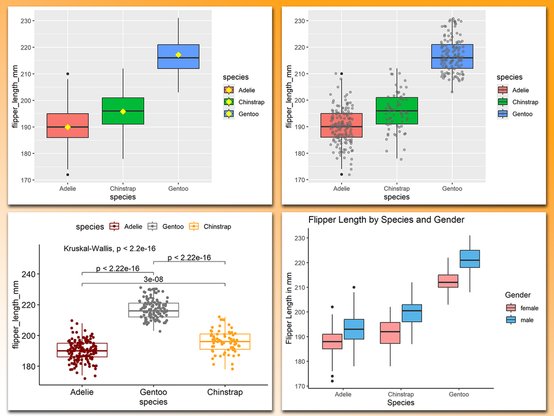
Basic boxplots are often not the best way to visualize your data! They can hide important information, such as the distribution of individual data points or group-specific differences.

The attached visual showcases several ways to enhance boxplots.

All of these examples were created using ggplot2 and extensions in R.

Click this link for detailed information: https://statisticsglobe.com/online-course-data-visualization-ggplot2-r

#statisticsclass #datavisualization #advancedanalytics #rprogramminglanguage #visualanalytics #package

Online Course: Data Visualization in R Using ggplot2 & Friends

The Ultimate Course to Quickly Master Data Visualization in R Using ggplot2 & Friends - Instructor: Joachim Schork - Statistics Globe

Statistics Globe
> .. example in the success of NAVY test flights...examination of Israeli test flights had shown that pilots who did well on one test flight usually did not fare as well on their..[next] flight. Overlooking the presence of regression to the mean, the Israeli flight instructors concluded that the praising the pilots was hindering the pilots ability... the decreases were.. part of a larger picture that involved #RegressionToTheMean.
https://economics-files.pomona.edu/garysmith/econ190/Econ190%202015/Jacob%20Wilson.pdf
#StatisticsClass #RegressionToMean
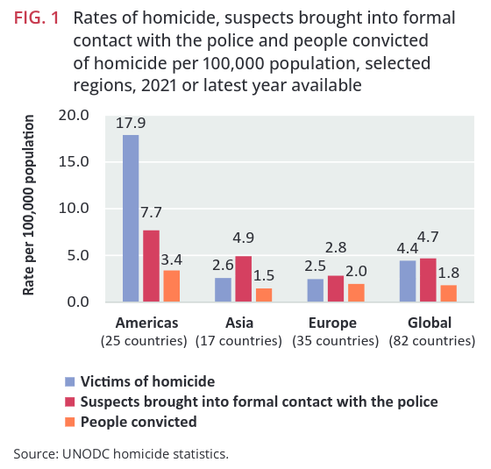
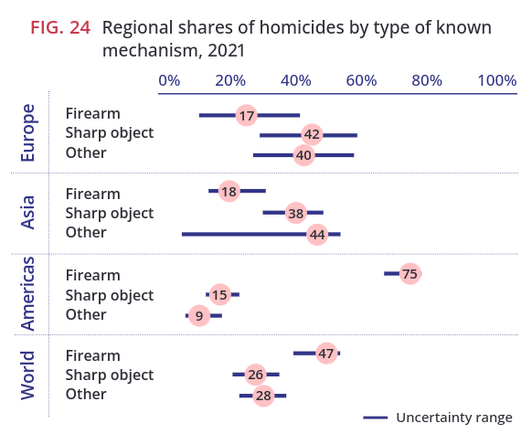
The Graphs and Statistics are fascinating in this UN Report. It might provide good exercises for a data or statistcs class: redesign the pie charts, find the original figures and design tables... Just learn from it.. It's a shame the text was garbled when I tried to copy direct from the .pdf..
https://www.unodc.org/documents/data-and-analysis/gsh/2023/Global_study_on_homicide_2023_web.pdf
#HomicideRates #MurderRate #StatisticsClass #LearningStatistics #UncertaintyGraphs #UncertaintyVisualization
🧵
> ... de Moivre's equation in action. The variation of the mean is inversely proportional to the sample size, so small counties display much greater variation than large counties. A county with, say, 100 inhabitants that has no cancer deaths would be in the lowest category. But if it has 1 cancer death it would be among the highest. Counties like Los Angeles, Cook or Miami-Dade with millions of inhabitants do not bounce around like that.
@bsmall2
#StatisticsClass #Variance #EstimatingMeans

In my opinion, R should be your go-to programming language!

Ready to explore the world of R? I've created a comprehensive online course that introduces R for beginners.

More information: https://statisticsglobe.com/online-course-r-introduction

#datavisualization #rstudio #dataanalytics #datasciencetraining #statisticsclass

Online Course: Introduction to R Programming for Absolute Beginners

The Ultimate Course to Quickly Master the R Programming Language for Absolute Beginners - Instructor: Joachim Schork - Statistics Globe

Statistics Globe
> Probability is expectation founded upon partial knowledge. A perfect acquaintance with all the circumstances affecting the occurrence of an event would change expectation into certainty, and leave neither room nor demand for a theory of probabilities.
https://gutenberg.org/ebooks/15114
#Boole #GeorgeBoole #StatisticsClass #GutenbergEbook
An Investigation of the Laws of Thought by George Boole

Free kindle book and epub digitized and proofread by volunteers.

Project Gutenberg

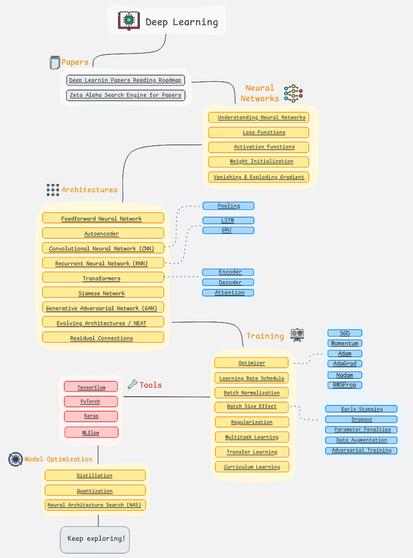
If you're looking to master Deep Learning, following a structured roadmap is key to navigating this advanced and ever-evolving field.

I came across this roadmap on the AIGENTS website, and what really stands out is its interactive format. Each element is clickable, offering AI-powered insights and resources that make it easier to dive deeper into each topic. Check out this link for more details: https://aigents.co/learn/roadmaps/deep-learning-roadmap

#statisticsclass #pythonprojects #datascienceeducation

Deep Learning Roadmap

A step-by-step guide on how to become a Deep Learning Engineer. You'll learn about Neural Networks, ML/ DL architecture, and Models Optimization. Complete the Machine Learning Roadmap before taking this path.

> Bertrand Russell has this great quote, “This is one of those views which are so absurd that only very learned men could possibly adopt them.” On the other hand, there’s this from George Orwell: “To see what is in front of one’s nose needs a constant struggle.”
https://statmodeling.stat.columbia.edu/2019/06/25/another-regression-discontinuity-disaster-and/
#StatisticsClass #AndrewGelman #BertrandRussel #GeorgeOrwell