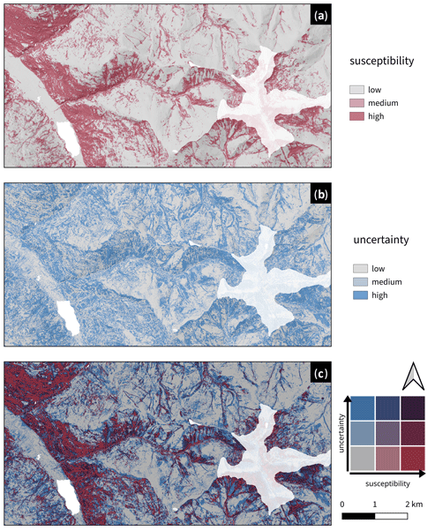
Thrilled to share our latest publication "Visualizing uncertainties in landslide susceptibility modelling using bivariate mapping" https://nhess.copernicus.org/articles/25/1425/2025/
What’s inside:
✅ A new way to jointly visualize susceptibility & uncertainty in landslide prediction
✅ Practical, open-source tools for implementation in R and QGIS
Loved the interdisciplinarity of this project
#DisasterRiskReduction #Landslides #QGIS #RStats #GISChat #UncertaintyVisualization #NaturalHazards

Brief communication: Visualizing uncertainties in landslide susceptibility modelling using bivariate mapping
Abstract. Effectively communicating uncertainties inherent to statistical models is a challenging yet crucial aspect of the modelling process. This is particularly important in applied research, where output is used and interpreted by scientists and decision-makers alike. In disaster risk reduction, susceptibility maps for natural hazards are vital for spatial planning and risk assessment. We present a novel type of landslide susceptibility map that jointly visualizes the estimated susceptibility and the corresponding prediction uncertainty, using an example from a mountainous region in Carinthia, Austria. We also provide implementation guidelines to create such maps using popular free and open-source software packages.

