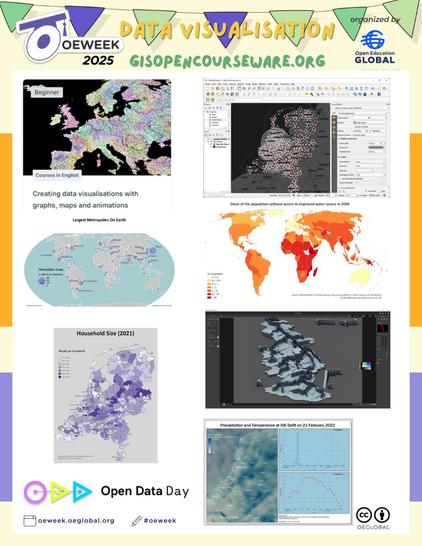
🚀 Wrapping up the last day of #OpenEducationWeek2025, coinciding with #OpenDataDay! Using fantastic open data to create amazing and fun map designs. 🌍💻
Highlighting the course: Creating data visualisation with graphs, maps, and animations! 🌟 Topics include:
📍 Symbolizing Points by Varying Size
🌡️ Creating Heatmaps
🗺️ Creating Choropleth Maps
🧩 Visualizing Mesh Data
🎞️ Creating Animations
Learn more here: https://courses.gisopencourseware.org/course/view.php?id=51