113°F today. 117°F tomorrow. Temps above 110°F through Friday.
Excessive Heat Warnings are in effect.
Stay hydrated, rest often and avoid outdoor activity if possible.
Need heat relief? Find cooling centers: https://t.co/o2Cpr0xIE3
#AZHeat #ExcessiveHeatWarning #azwx https://t.co/3woLcRK94g

Jul 08, 12:23pm -0700

Is it hot in the SF Bay Area? Does anyone happen to know?

#ExcessiveHeatWarning #iOS18

Area in purple has an #ExcessiveHeatWarning today. To read NOAA’s forecast discussion, open the map, click inside any red-outlined area and follow the link. The text screenshot is from the discussion that includes SE MN and part of WI and IA.
#MNwx #WIwx #IAwx #ILwx

All of which reminds me - I grew up in MN and the last year I lived there the temperature swing was from 37 below to 105 above. Those extremes were too much for my delicate sensibilities which is why I moved to the PNW. Plus I liked the idea of *really* big trees.

Open GISsurfer map:
https://mappingsupport.com/p2/gissurfer.php?center=43.471530,-91.274414&zoom=5&basemap=USA_basemap&overlay=State_boundary,Weather_watch_warning,Forecast_discussion&data=https://mappingsupport.com/p2/special_maps/disaster/USA_weather.txt

GISsurfer General Purpose Web Map and GIS Viewer | Surf GIS DATA

GISsurfer lets you surf a nearly endless amount of GIS data. Click a layer in the GIS server's table of contents and that data appears on the map.

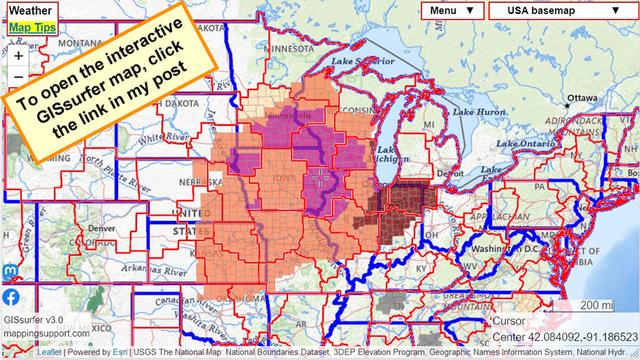
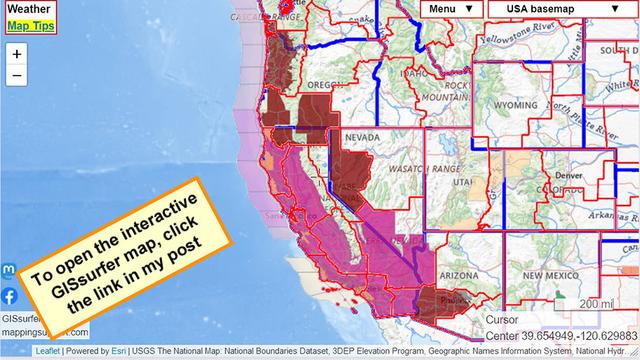
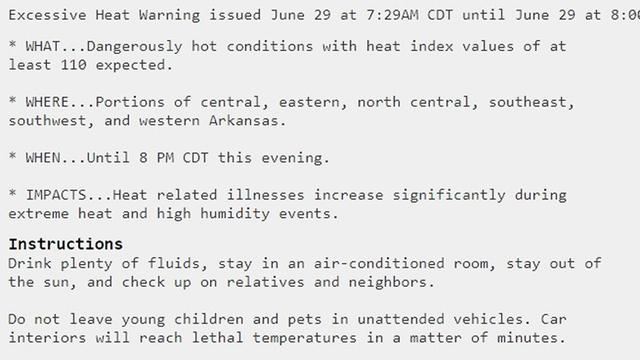
#ExcessiveHeatWarning (purple area) continues for parts of Texas and Oklahoma. For details from NOAA, open map, click colored area, follow link.

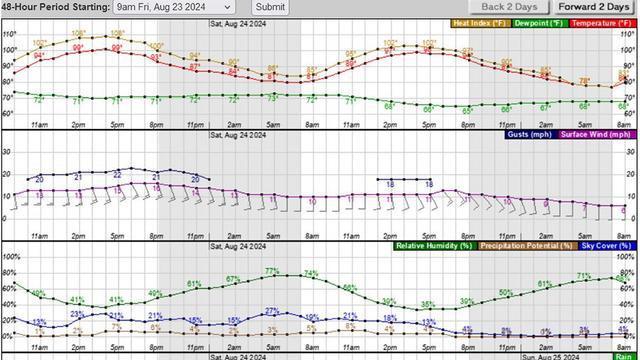
Screenshot with graphs shows ‘heat index’ near 110 at Forth Worth airport today and tomorrow.

To see similar graphs for anywhere in USA, right click the map. Then in the sidebar that appears - click “Hourly forecast”.

Mobile users can do a simulated rightclick. Please see the “Map tips” for help.
#TXwx #OKwx #ClimateChange

Meanwhile, photo looking out into our pasture says it all about PNW weather today near Redmond WA. Cool, low clouds, showers followed by rain.

Open GISsurfer map:
https://mappingsupport.com/p2/gissurfer.php?center=33.000065,-98.898926&zoom=6&basemap=USA_basemap&overlay=State_boundary,Weather_watch_warning&data=https://mappingsupport.com/p2/special_maps/disaster/USA_weather.txt

GISsurfer General Purpose Web Map and GIS Viewer | Surf GIS DATA

GISsurfer lets you surf a nearly endless amount of GIS data. Click a layer in the GIS server's table of contents and that data appears on the map.

Thursday brought a hot beginning to August in Montana & Wyoming, but Friday may bring more record-breaking heat! I'll have your 7-day weather forecast on KTVQ & MTN at 4:30, 5:30 & 10!

#Montana #Billings #Q2 #KTVQ #MTN #Wyoming #sun #heat #heatwave #heatdanger #HeatAdvisory #ExcessiveHeatWarning #Thursday #Friday #weather #wx #mtwx #wywx #MastodonWeather #MastodonWx #WeatherMastodon #WxMastodon

I listen to California-based public radio often, and sometimes hear the US weather report issuing an "excessive heat warning."

I imagine some hyperbolic guy screaming "It's going to be really HOT!"

And someone responding "Well that's a bit excessive, jeez relax dude."

#ExcessiveHeatWarning

I cannot help thinking that the people with the power to change the direction the planet is going regarding the #ClimateCrisis are all waiting for someone else to fix the problem.

Most of the colors on this map are heat related watches and warnings.🥵 😟

For details, including timing, open the map, zoom in, click any colored area. Scroll down in the popup since each type of watch or warning has its own link for the details.

To search on your address click Menu > Search.
#HeatWave #ExtremeHeat #ExcessiveHeatWarning #Climate

Open GISsurfer map:
https://mappingsupport.com/p2/gissurfer.php?center=37.403023,-101.337891&zoom=4&basemap=USA_basemap&overlay=State_boundary,Weather_watch_warning&data=https://mappingsupport.com/p2/special_maps/disaster/USA_weather.txt

GISsurfer General Purpose Web Map and GIS Viewer | Surf GIS DATA

GISsurfer lets you surf a nearly endless amount of GIS data. Click a layer in the GIS server's table of contents and that data appears on the map.

Your choices are hot, hotter or broiling.

To read NOAA’s detailed forecast discussion open the map, click in any red-outlined area and follow the link. The text pic is snipped from the discussion for the Hanford forecast area.

Even here in the greater Seattle area temps are expected in the mid 90s next weekend. Of course for some of you that will seem cool by comparison.
#Climate #HeatWave #ExcessiveHeatWarning

Open GISsurfer map:
https://mappingsupport.com/p2/gissurfer.php?center=39.654949,-120.629883&zoom=5&basemap=USA_basemap&overlay=State_boundary,Weather_watch_warning,Forecast_discussion&data=https://mappingsupport.com/p2/special_maps/disaster/USA_weather.txt

GISsurfer General Purpose Web Map and GIS Viewer | Surf GIS DATA

GISsurfer lets you surf a nearly endless amount of GIS data. Click a layer in the GIS server's table of contents and that data appears on the map.

Here's a sweet way to apologize for "heated" words in sweltering California. An Excessive Heat Warning will be in effect from Tuesday through Sunday... highs of 105° to 115° expected! Stay cool and safe!

#California #ExcessiveHeatWarning #heat #heatwave #heatdanger #cake #dessert #food #foodie #foodporn #funny #humor #apology

#ExcessiveHeatWarning for reddish area on this interactive GIS map.

For details, including timing, open the map, zoom in, click any colored area. Scroll down in the popup since each type of watch or warning has its own link for the details.

To search on your address click Menu > Search.
#HeatWave #ExtremeHeat #OKwx #ARwx #TNwx #TXwx #LAwx #MSwx

Open #GISsurfer map:
https://mappingsupport.com/p2/gissurfer.php?center=33.623786,-93.955078&zoom=6&basemap=USA_basemap&overlay=State_boundary,Weather_watch_warning&data=https://mappingsupport.com/p2/special_maps/disaster/USA_weather.txt

GISsurfer General Purpose Web Map and GIS Viewer | Surf GIS DATA

GISsurfer lets you surf a nearly endless amount of GIS data. Click a layer in the GIS server's table of contents and that data appears on the map.