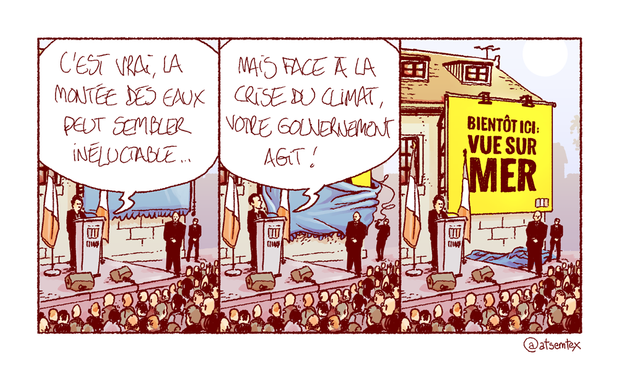
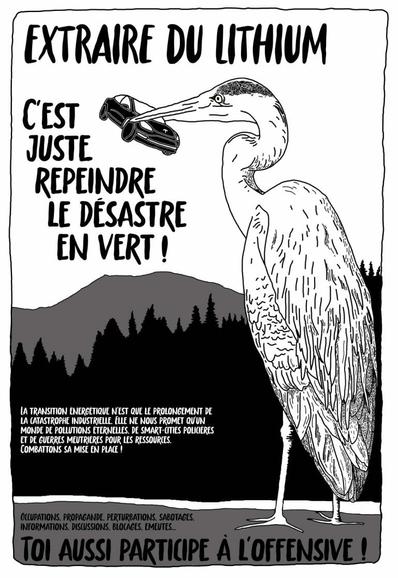
Extraire du lithium, c’est juste repeindre le désastre en vert !
Soumission anonyme à MTL Contre-info
Affiche : pdf 11 x 17...
https://mtlcontreinfo.org/extraire-du-lithium-cest-juste-repeindre-le-desastre-en-vert/

Aime la couleur verte, la lumière, l'odeur de la pluie, boire du thé et se perdre dans les ruelles de Montréal🚶♀️
Les photos sont de moi sauf si précisé. 📷
2e compte avec des images seulement :
@bloui
| Lieu | Montréal / Tiohtià:ke |
| Pronoms | Elle/She/Her |
| Sujets préférés | Photographie, arts, environnement, biodiversité |
| Site | https://www.micheledelisle.com |
Extraire du lithium, c’est juste repeindre le désastre en vert !
Soumission anonyme à MTL Contre-info
Affiche : pdf 11 x 17...
https://mtlcontreinfo.org/extraire-du-lithium-cest-juste-repeindre-le-desastre-en-vert/
"Avant de dire au revoir à ses homologues, le bureau du premier ministre du Canada a émis six déclarations communes sur autant de sujets. Aucune d’entre elles ne mentionne l’existence des changements climatiques, et encore moins des actions supplémentaires à prendre pour lutter contre ce problème."
Évidement... ce n'est pas bon pour l'économie 🤷🏻♀️
Finalement pas un mot du G7 sur les changements climatiques - https://www.ledevoir.com/environnement/892360/finalement-pas-mot-g7-changements-climatiques
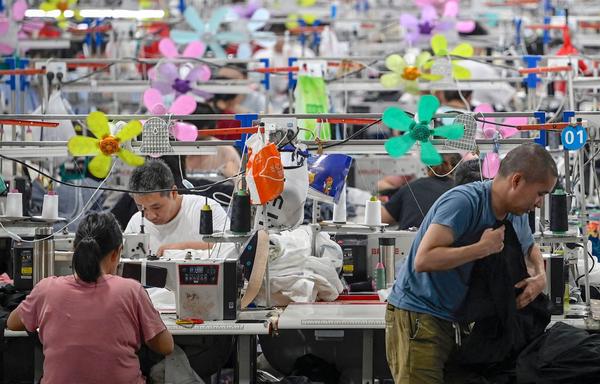
"Pire, d’ici 2050, le secteur du textile risque de produire pas moins de 25 % des émissions mondiales de gaz à effet de serre si les tendances actuelles de consommation se poursuivent, dont la mode éphémère. « Toutes ces émissions sont produites pour fabriquer des vêtements qui sont de piètre qualité et produits dans des conditions de travail qui sont inacceptables », déplore Amélie Côté."
La quantité de vêtements jetés au Québec a plus que doublé en 10 ans - https://www.ledevoir.com/environnement/892264/quantite-vetements-jetes-quebec-plus-double-10-ans
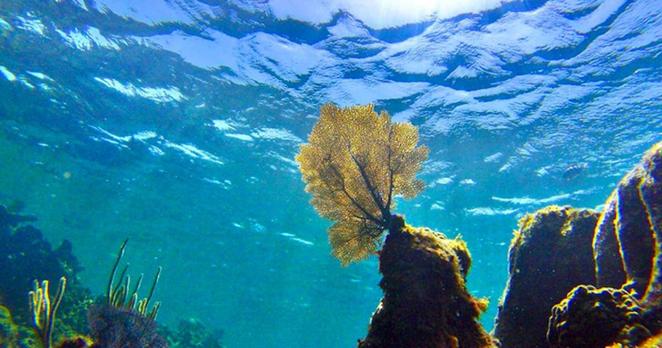
"C’est une mauvaise nouvelle pour les écosystèmes marins en général, entre autres pour toutes les créatures qui ont un squelette externe ou une coquille: une eau plus acide fragilise ces carapaces, voire les empêche de se former. Les coraux sont également à risque."
La 7e des 9 limites planétaires franchie - https://www.sciencepresse.qc.ca/actualite/2025/06/13/7e-9-limites-planetaires-franchie
Me: It doesn't have a tail, so I'm pretty sure it's a hamster.
Tech support: “sigh”
Fine. Right click on your hamster...
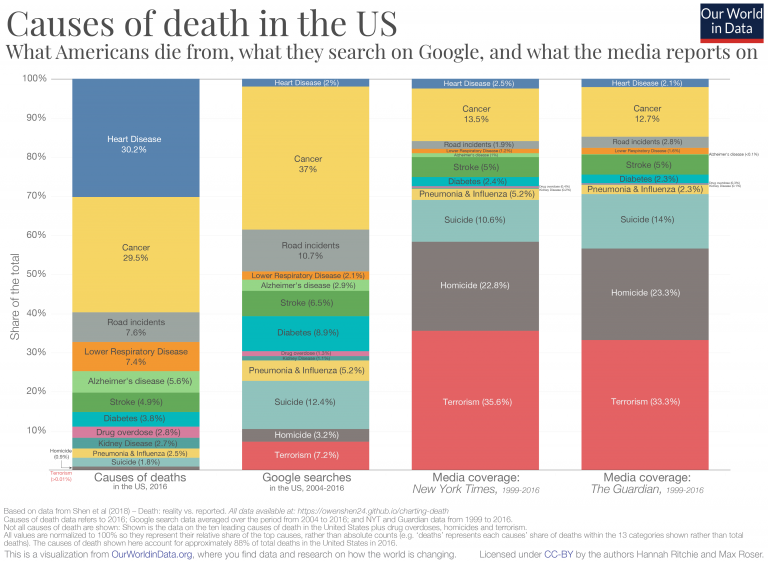
I always find this chart by Hannah Ritchie -- of Our World In Data -- deeply informative of how disjointed is our sense of personal risk

« L’opinion publique québécoise est favorable à ce que le Québec devienne un joueur d'importance dans le domaine de la défense, a affirmé M. Legault dimanche.»
PARDON ?!?
Il y a des politiciens qui entendent des voix.
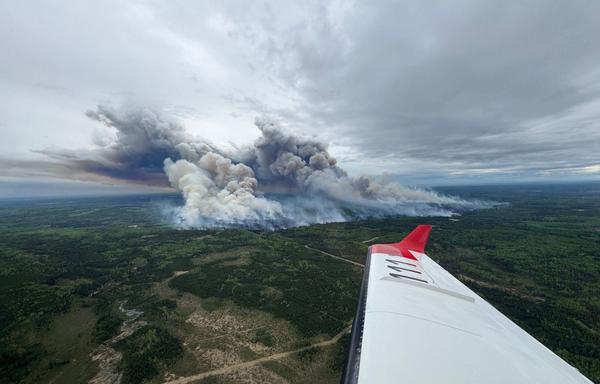
Et le mois de juillet n'est même pas encore commencé. All is fine 🔥
La saison 2025 des feux de forêt est l’une des pires jamais enregistrées au Canada - https://www.ledevoir.com/environnement/890620/saison-2025-feux-foret-est-pires-jamais-enregistrees-canada
I always find this chart by Hannah Ritchie -- of Our World In Data -- deeply informative of how disjointed is our sense of personal risk
yep yep
Actually, wait, they're not!
The media figures are from 1999 to 2016, before ozempic and its peers were released
Right?
People -- and media -- seem to focus with roughly-correct proportionality to cancer
But they wildly under-focus on heart disease ...
... and wildly over-focus on terrorism, homicide, and suicide -- particularly the media sources
@clive Skip the Xitter link and go straight to the referenced article here: https://ourworldindata.org/causes-of-death
(Edit: apparently doesn’t include the chart shown in the Xitter post).
I actually went originally to that piece, and went through the deck of slides ... I wanted to direct link to the graphic
but I couldn't find it
I wondered if Ritchie had made it as a special one-off just to post on xitter
Outliers are newsworthy, exactly. Also, fear sells, and we tend to be more scared of things that can be suddenly inflicted by others (violence) vs. what we self-inflict (health.)
See also: people more scared of statistically safer air travel than of car travel ("but *I'm* a good driver...")
yes, precisely
Is heart disease really self-directed though?
America is a nation designed by the fossil fuel industry to use cars for everything.
Koch Network fights initiatives like walkable cities, bike paths, & public transit.
The industry fomented "white flight" to the suburbs & got the middle class to give up billions in now-valuable real estate in inner core cities.
They funded anti-lockdown covid disinformation & back to the office narratives to keep people commuting
I was generalizing, yes, based more on perception than details.
The political and environmental climate is an external threat to health. But it's the everyday situation that most of us were born into.
We've been taught it's on us to self-help, via "food pyramids" and "Presidential Youth Fitness Programs" and commercialized individual remedies -- diets & workouts & medications -- in our faces at every ad break.
Agreed. The weaponization of "personal responsibility" narratives are pernicious.
As longevity studies have shown over & over, society plays a significant role in health determinants.
There are group solutions needed to group problems of health.
One of these is the "work until you drop" ethos promoted by billionaires, no retirement, no sick days, no work from home, no long weekends, no vacations.
yeah, also terrorism and homicide involve human intent and human activity, which holds understandable intrigue
that said, it doesn't quite explain the gulf between cancer and heart disease ... I gotta think about why that difference is so big
yeah, that’s a really good point!
and also, the things that improve heart health are things people tend to not want to do lol
It is documented here. I suspect one factor is that keywords used for heart disease are too few and unspecific (e.g. they do not include “heart attack”, “angina”, “cardiac disease”). The string “cancer” is probably most often included in articles about specific cancers, so you do not have the same problem there. (By the way, why that block-matching function, instead of regexes?)
https://github.com/owenshen24/charting-death-analysis/blob/main/FinalProject.ipynb
@clive @fuminghumanist One might also find similar bias within media reporting about specific causes of mortality and morbidity.
E.g. articles on breast cancer may focus on young women out of proportion to the actual age distribution of the disease. Articles on sepsis often focus on meningococcal disease, which causes about 0.1 % of sepsis in Sweden (but can be rapidly progressive in teenagers and young adults).
yeah, I think that's right
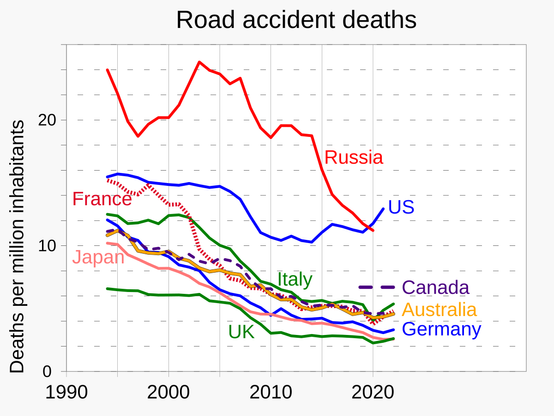
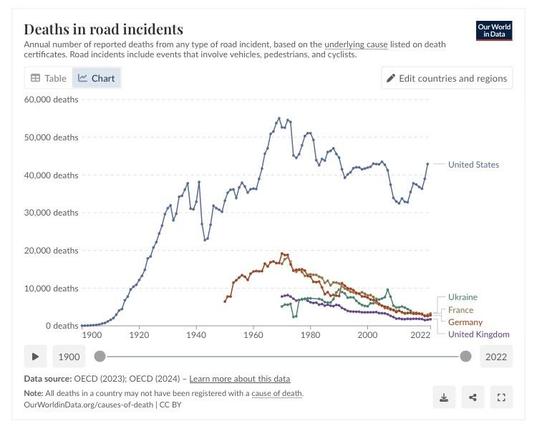
@clive Suicide overlook traffic violence as a cause of death some time ago. https://afsp.org/suicide-statistics/
Just under 50k in 2023 vs around 40k to traffic violence.
The chart has traffic violence as 5x higher than suicide.
Lolol yes
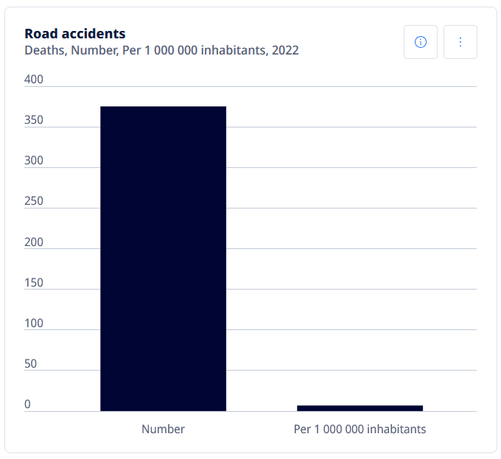
I don't think those numbers can be right. The infographic says that 7.6% of people die in road incidents, but Wikipedia says that only ten people per million die on the roads every year. If people live to 80 (and so they have 80 chances to become one of the 10ppm) then the proportion of people dying on the roads is 800ppm, which is 0.8%, which is one tenth of the claimed figure. I'm not saying road deaths don't matter, but I find Wikipedia's figure more believable than the one in the infographic.
https://en.m.wikipedia.org/wiki/Motor_vehicle_fatality_rate_in_U.S._by_year
@CppGuy @clive That's per hundred thousand, not per million.
(I thought the figure was way off - in my country of about five million there are a few hundred traffic fatalities per annum - looking at https://en.wikipedia.org/wiki/List_of_countries_by_traffic-related_death_rate the USA is fairly average and we're a bit below average in number).
Different metrics, same sources, both reported on OWID & Wikipedia in different articles/charts.
Converting is tricky:
* causes of death aren't distributed equal across age groups as younger ppl have different risks than older ones,
* the "total" changes by age group over time because death,
* you can't extrapolate flat from one year because risks change over time (1950-2030 differs from 1990-2070).
Explore:
https://ourworldindata.org/causes-of-death#all-charts
@clive
I would like to see this chart, but with percentage of lost Quality Adjusted Life Years instead of percentage of deaths.
It would be a more realistic measurement of impact and bring suicides and accidents a bit more in line with press coverage.
@clive I agree with have a disjointed sense of personal risk (sharks etc), but disagree that these charts have anything to do with it.
1) It makes a lot of sense for various reasons to search for [cancer] or [suicide], probably not as much [heart disease]. Instead, people would search for things like [lower cholesterol] – was that lumped in those tiny blue bars up there?
2) Some causes of death are more newsworthy than others, and rightly so. 30–40% of people dying from cancer has kinda just been the way it is for many decades. Everyone knows cancer is bad; there's going to be some news coverage of shifts in frequency or new treatments and preventative measures, but what else would you expect to be in the news?
I don't get this idea that we should be collectively wringing our hands about things in proportion to death risk. e.g. of course I want to spend more time in political debates talking about terrorism or homicide than I do about diabetes; that's obvious, right?
FWIW I spend time roughly proportional to the leftmost chart on each cause when talking to my doctor.
Yeah very good point!
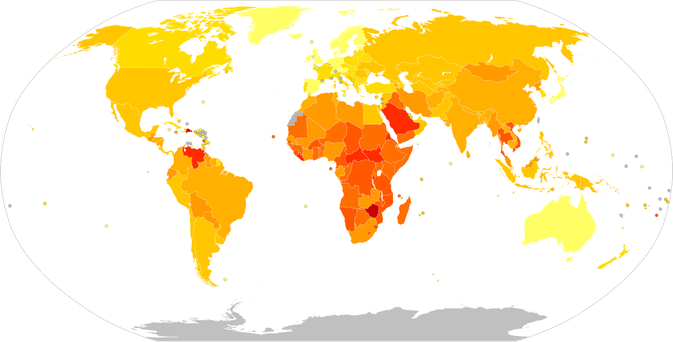
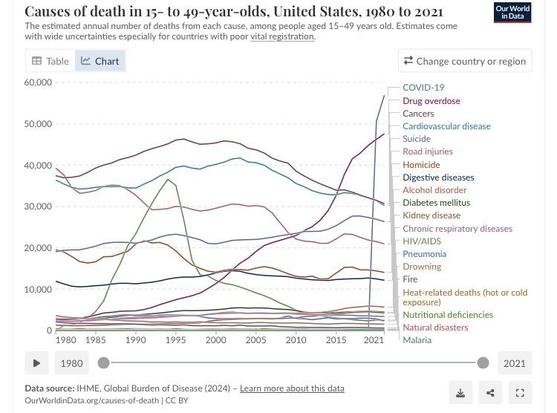
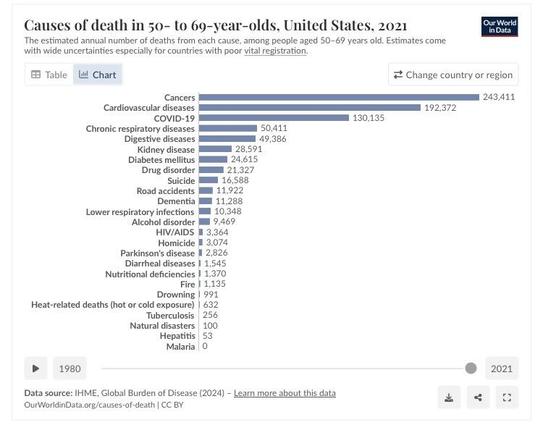
@clive It’s interesting to explore #CausesOfDeath further, especially from a global perspective, here:
@clive As others have already said: It's *partly* understandable, maybe unavoidable. Everyone has to die of *something* eventually. So, an old person dying from a heart or respiratory disease or from cancer is not a news story in and of itself. A homicide or terrorist attack is.
I guess, the bigger problem is *how* the media coverage is done, if it helps inciting exaggerated panic and establishing policies that harm a lot of other peoples' rights while trying to prevent terrorism.