Since there's no proprietary webp graph export in #rstats, I wrote a little wrapper function combining ggsave and some {magick}-magic.
Feel free to try it out:
https://github.com/nucleic-acid/webpea
I'm always happy to get feedback and suggestions!


Fascinated by small scales 🧬, large scales 🪐 and all things #data in between.
I explore #opendata using #opensource tools, such as #Rstats and #python.
#datascience #datavis #dataviz #opensource #fedi22 #openscience #science #astronomy #sciencecommunication #scicomm
| blog | https://jollydata.blog |
| github | https://github.com/nucleic-acid |
| genetics | https://genomic.social/@basepair |
Since there's no proprietary webp graph export in #rstats, I wrote a little wrapper function combining ggsave and some {magick}-magic.
Feel free to try it out:
https://github.com/nucleic-acid/webpea
I'm always happy to get feedback and suggestions!
#TidyTuesday week 8: The colors Bob Ross used in his paintings.
The paintings are clustered via dimension reduction (UMAP) of the used colors. The points are colored according sentiment analysis of the paintings' titles.
</> https://github.com/nucleic-acid/TidyTuesdaySubmissions/tree/main/2023-w08

Late to the game for week 6 of #TidyTuesday: Big tech stock prices.
I struggled with this subject to find actual insights. So I focused more on building a plot as legend.
</> https://github.com/nucleic-acid/TidyTuesdaySubmissions/tree/main/2023-06
#TidyTuesday | Week 5 (2023)
Older pet cats in the UK don't seem to slow down with age. But they catch less prey.
</> https://github.com/nucleic-acid/TidyTuesdaySubmissions/tree/main/2023-05
Took inspiration regarding the icons in the caption from @danoehm.
'Survival'-plot of the survival TV series "Alone" for #TidyTuesday week 4/2023.
I'm focusing on probability of drop-outs due to "tapping out", not counting medically indicated evacuations.
Data by @danoehm.
First time using the #rstats 📦 {survival} & {survminer} and limited time, so not really polished.
There are a lot of new open data sets published by Munich Open Data:
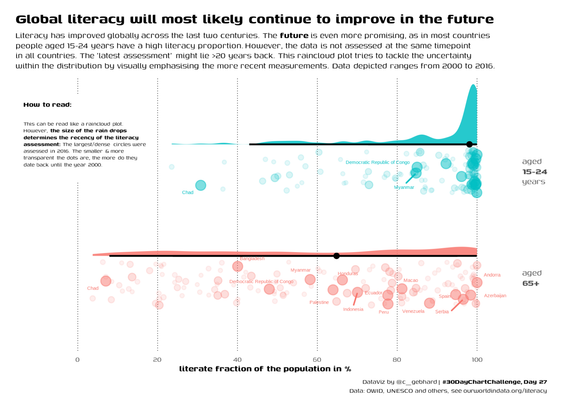
#Day27 - Topic: future
Global literacy will most likely improve in the foreseeable future.
This is an experimental take on a raincloud plot due to varying "latest assessment" years. Rain drops are of different size and opacity: the further the latest literacy assessment lies back in time, the smaller and fainter the drops are.
#30DayChartChallenge #30DCCNov22Reposts
Tool: #rstats
Data: @ourworldindata
Font: Genos
Code: https://github.com/nucleic-acid/30DayChartChallenge_2022
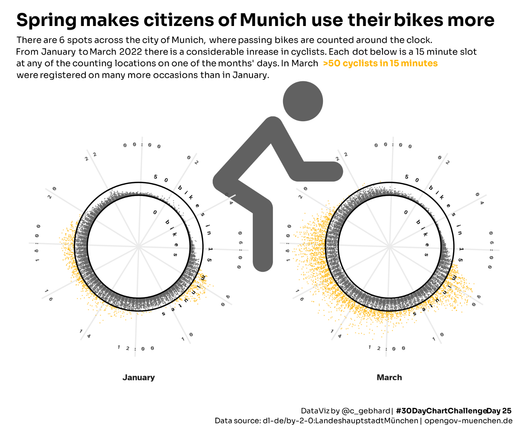
Cyclist counts showed an upward trend in Q1 2022 in Munich (Germany). Considering the seasonal weather improvement, this should be expected.
#30DayChartChallenge #30DCCNov22Reposts #Day25 - Topic: trend
Tool: #rstats
Data: opendata.muenchen.de
Code: https://github.com/nucleic-acid/30DayChartChallenge_2022
#Day21 - Topic: down/upward
Parents in Germany are getting older at the time of childbirth.
Known limitation of the chart: cropped y-axis. Tried to emphasize that with larger tick labels.
Feedback welcome on how to visualize the small changes better.
Tool: #rstats
Data: @destatis Code: https://github.com/nucleic-acid/30DayChartChallenge_2022


